Industry: Healthcare | Publish Date: 05-May-2020 | No of Pages: 477 | No. of Tables: 271 | No. of Figures: 241 | Format: PDF | Report Code : N/A
The global Electrophysiology Market held USD 5.20 billion in 2019 and is predicted to reach USD 15.75 billion by 2030 with a CAGR of 10.6% from 2020-2030. Electrophysiology (EP) is the assessment of electrical impulses of the heart. It helps to evaluate abnormal heartbeats. The fast increase in the aging population is accountable for increasing heart failure rates. The significant advancement in the EP technologies have improved the ability to target the areas of the heart perpetuating that leads to atrial fibrillation (AF).
Market Dynamics and Trends
The improving and modernizing healthcare infrastructure as well as huge burden of target diseases in developing nations has proliferated the electrophysiology market trend. Furthermore, the number of ablation procedures for the treatment of atrial fibrillation will increase the electrophysiology market size.
The factors including increasing prevalence of target diseases, technological advancements in the field of electrophysiology, and increasing demand for catheter ablation procedures has majorly driven the electrophysiologymarket. Further, increasing preference of EP catheter ablation for cardiac arrhythmia treatment. However, high cost of the EP device and dearth of skilled electrophysiologists may limit the growth of the electrophysiology market share. The lucrative opportunities in emerging economies and rising awareness regarding the EP technologies will create new opportunities for the market growth in future.
Market Segmentation and Scope of the Study
The electrophysiology market is segmented on the basis of product, target disease, and geography.On the basis of product, the market is segmented into ablation catheters, diagnostic catheters, laboratory devices, access devices, and others.The ablation catheters is sub segmented into cryoablationEP catheters, radiofrequency ablation catheters, microwave ablation systems, laser ablation systems, and others. The laboratory devices segment is further divided into EP x-ray systems, 3D mapping systems, EP recording systems, EP remote steering systems, and others. The diagnostic catheterssegment is further sub segmented into conventional EP diagnostic catheters, advanced EP diagnostic catheters, and ultrasound EP diagnostic catheters. On the basis of target disease, the market is divided intoatrial fibrillation, atrioventricular nodal reentry tachycardia, atrial flutter, wolff-parkinson-white syndrome, and other. Geographic breakdown and analysis of each of the aforesaid segments includes regions comprising North America, Europe, Asia-Pacific, and RoW.
Geographic Analysis
North America denotes a higher adoption of the electrophysiology and is anticipated hold the highest market share during the forecast period. This is attributable to the factors including presence of well-established healthcare amenities, rise in the number of arrhythmia & heart failure cases, and technological advancements. It is expected that the emerging economies, specifically in the Asia-Pacific region would witness increasing marketsize owing to increasing accessibility to healthcare facilities in the region, increasing medical tourism, and increasing incidences of heart failure cases.
Competitive Landscape
Comprehensive competitive analysis and profiles of the major market players such as Siemens AG, Medtronic plc,St. Jude Medical, Inc., Biosense Webster, Inc., Philips Healthcare, Biotronik SE & Co.KG, Boston Scientific Corporation, GE Healthcare, Microport Scientific Corporation, Abbott Laboratories, and others are provided in the electrophysiology market report.
KEY MARKET SEGMENTS:
North America
U.S.
Canada
Mexico
Europe
UK
Italy
Germany
Spain
Netherlands
Rest of Europe
Asia-Pacific
China
Japan
India
Australia
South Korea
Taiwan
Vietnam
Rest of Asia Pacific
RoW
Latin America
Middle East
Africa
1. INTRODUCTION
1.1. REPORT DESCRIPTION
1.2. Research Methodology
1.2.1 Secondary Research
1.2.2 Data Analysis Framework
1.2.3 Market size estimation
1.2.4 Forecasting
1.2.5 Primary Research and Data Validation
2. MARKET SNAPSHOT, 2019-2030 Million USD
2.1. MARKET SNAPSHOT
3. PORTER’S FIVE FORCE MODEL ANALYSIS
4. MARKET DYNAMICS
4.1. GROWTH DRIVERS
4.1.1 DRIVER 1
4.1.2 DRIVER 2
4.1.3 DRIVER 3
4.1.4 DRIVER 4
4.2. CHALLENGES
4.2.1 CHALLENGE 1
4.2.2 CHALLENGE 2
4.3. OPPORTUNITIES
4.3.1 OPPORTUNITY 1
4.3.2 OPPORTUNITY 2
5. Global Electrophysiology Market, By Product
5.1. Overview
5.2. EP Ablation Catheters
5.2.1 Global EP Ablation Catheters Market, By Product
5.2.1.1 Cryoablation EP Catheters Market, By Region
5.2.1.1.1 North America Cryoablation EP Catheters Market, By Country
5.2.1.1.2 Europe Cryoablation EP Catheters Market, By Country
5.2.1.1.3 Asia-Pacific Cryoablation EP Catheters Market, By Country
5.2.1.1.4 Rest of World Cryoablation EP Catheters Market, By Country
5.2.1.2 Radiofrequency (RF) Ablation Catheters Market, By Region
5.2.1.2.1 North America Radiofrequency (RF) Ablation Catheters Market, By Country
5.2.1.2.2 Europe Radiofrequency (RF) Ablation Catheters Market, By Country
5.2.1.2.3 Asia-Pacific Radiofrequency (RF) Ablation Catheters Market, By Country
5.2.1.2.4 Rest of World Radiofrequency (RF) Ablation Catheters Market, By Country
5.2.1.3 Irrigated-tip RF Ablation Catheters Market, By Region
5.2.1.3.1 North America Irrigated-tip RF Ablation Catheters Market, By Country
5.2.1.3.2 Europe Irrigated-tip RF Ablation Catheters Market, By Country
5.2.1.3.3 Asia-Pacific Irrigated-tip RF Ablation Catheters Market, By Country
5.2.1.3.4 Rest of World Irrigated-tip RF Ablation Catheters Market, By Country
5.2.1.4 Microwave Ablation (MWA) Systems Market, By Region
5.2.1.4.1 North America Microwave Ablation (MWA) Systems Market, By Country
5.2.1.4.2 Europe Microwave Ablation (MWA) Systems Market, By Country
5.2.1.4.3 Asia-Pacific Microwave Ablation (MWA) Systems Market, By Country
5.2.1.4.4 Rest of World Microwave Ablation (MWA) Systems Market, By Country
5.2.1.5 Laser Ablation Systems Market, By Region
5.2.1.5.1 North America Laser Ablation Systems Market, By Country
5.2.1.5.2 Europe Laser Ablation Systems Market, By Country
5.2.1.5.3 Asia-Pacific Laser Ablation Systems Market, By Country
5.2.1.5.4 Rest of World Laser Ablation Systems Market, By Country
5.2.1.6 Navigational Advanced Mapping Accessories Market, By Region
5.2.1.6.1 North America Navigational Advanced Mapping Accessories Market, By Country
5.2.1.6.2 Europe Navigational Advanced Mapping Accessories Market, By Country
5.2.1.6.3 Asia-Pacific Navigational Advanced Mapping Accessories Market, By Country
5.2.1.6.4 Rest of World Navigational Advanced Mapping Accessories Market, By Country
5.2.2 EP Ablation Catheters Market, By Region
5.2.2.1 North America EP Ablation Catheters Market, By Country
5.2.2.2 Europe EP Ablation Catheters Market, By Country
5.2.2.3 Asia-Pacific EP Ablation Catheters Market, By Country
5.2.2.4 Rest of World EP Ablation Catheters Market, By Country
5.3. EP Laboratory Devices
5.3.1 Global EP Laboratory Devices Market, By Product
5.3.1.1D mapping systems Market, By Region
5.3.1.1.1 North America 3D mapping systems Market, By Country
5.3.1.1.2 Europe 3D mapping systems Market, By Country
5.3.1.1.3 Asia-Pacific 3D mapping systems Market, By Country
5.3.1.1.4 Rest of World 3D mapping systems Market, By Country
5.3.1.2 EP recording systems Market, By Region
5.3.1.2.1 North America EP recording systems Market, By Country
5.3.1.2.2 Europe EP recording systems Market, By Country
5.3.1.2.3 Asia-Pacific EP recording systems Market, By Country
5.3.1.2.4 Rest of World EP recording systems Market, By Country
5.3.1.3 EP X-Ray systems Market, By Region
5.3.1.3.1 North America EP X-Ray systems Market, By Country
5.3.1.3.2 Europe EP X-Ray systems Market, By Country
5.3.1.3.3 Asia-Pacific EP X-Ray systems Market, By Country
5.3.1.3.4 Rest of World EP X-Ray systems Market, By Country
5.3.1.4 EP remote steering systems Market, By Region
5.3.1.4.1 North America EP remote steering systems Market, By Country
5.3.1.4.2 Europe EP remote steering systems Market, By Country
5.3.1.4.3 Asia-Pacific EP remote steering systems Market, By Country
5.3.1.4.4 Rest of World EP remote steering systems Market, By Country
5.3.1.5 Other EP Laboratory Devices Market, By Region
5.3.1.5.1 North America Other EP Laboratory Devices Market, By Country
5.3.1.5.2 Europe Other EP Laboratory Devices Market, By Country
5.3.1.5.3 Asia-Pacific Other EP Laboratory Devices Market, By Country
5.3.1.5.4 Rest of World Other EP Laboratory Devices Market, By Country
5.3.2 EP Laboratory Devices Market, By Region
5.3.2.1 North America EP Laboratory Devices Market, By Country
5.3.2.2 Europe EP Laboratory Devices Market, By Country
5.3.2.3 Asia-Pacific EP Laboratory Devices Market, By Country
5.3.2.4 Rest of World EP Laboratory Devices Market, By Country
5.4. EP Diagnostic Catheters
5.4.1 Global EP Diagnostic Catheters Market, By Product
5.4.1.1 Conventional EP Diagnostic Catheters Market, By Region
5.4.1.1.1 North America Conventional EP Diagnostic Catheters Market, By Country
5.4.1.1.2 Europe Conventional EP Diagnostic Catheters Market, By Country
5.4.1.1.3 Asia-Pacific Conventional EP Diagnostic Catheters Market, By Country
5.4.1.1.4 Rest of World Conventional EP Diagnostic Catheters Market, By Country
5.4.1.2 Advanced EP Diagnostic Catheters Market, By Region
5.4.1.2.1 North America Advanced EP Diagnostic Catheters Market, By Country
5.4.1.2.2 Europe Advanced EP Diagnostic Catheters Market, By Country
5.4.1.2.3 Asia-Pacific Advanced EP Diagnostic Catheters Market, By Country
5.4.1.2.4 Rest of World Advanced EP Diagnostic Catheters Market, By Country
5.4.1.3 Ultrasound EP Diagnostic Catheters Market, By Region
5.4.1.3.1 North America Ultrasound EP Diagnostic Catheters Market, By Country
5.4.1.3.2 Europe Ultrasound EP Diagnostic Catheters Market, By Country
5.4.1.3.3 Asia-Pacific Ultrasound EP Diagnostic Catheters Market, By Country
5.4.1.3.4 Rest of World Ultrasound EP Diagnostic Catheters Market, By Country
5.4.2 EP Diagnostic Catheters Market, By Region
5.4.2.1 North America EP Diagnostic Catheters Market, By Country
5.4.2.2 Europe EP Diagnostic Catheters Market, By Country
5.4.2.3 Asia-Pacific EP Diagnostic Catheters Market, By Country
5.4.2.4 Rest of World EP Diagnostic Catheters Market, By Country
5.5. Access Devices
5.5.1 Access Devices Market, By Region
5.5.1.1 North America Access Devices Market, By Country
5.5.1.2 Europe Access Devices Market, By Country
5.5.1.3 Asia-Pacific Access Devices Market, By Country
5.5.1.4 Rest of World Access Devices Market, By Country
6. Global Electrophysiology Market, By Indication
6.1. Overview
6.2. Atrial Fibrillation
6.2.1 Atrial Fibrillation Market, By Region
6.2.1.1 North America Atrial Fibrillation Market, By Country
6.2.1.2 Europe Atrial Fibrillation Market, By Country
6.2.1.3 Asia-Pacific Atrial Fibrillation Market, By Country
6.2.1.4 Rest of World Atrial Fibrillation Market, By Country
6.3. Atrial Flutter
6.3.1 Atrial Flutter Market, By Region
6.3.1.1 North America Atrial Flutter Market, By Country
6.3.1.2 Europe Atrial Flutter Market, By Country
6.3.1.3 Asia-Pacific Atrial Flutter Market, By Country
6.3.1.4 Rest of World Atrial Flutter Market, By Country
6.4. Atrioventricular Nodal Reentry Tachycardia
6.4.1 Atrioventricular Nodal Reentry Tachycardia Market, By Region
6.4.1.1 North America Atrioventricular Nodal Reentry Tachycardia Market, By Country
6.4.1.2 Europe Atrioventricular Nodal Reentry Tachycardia Market, By Country
6.4.1.3 Asia-Pacific Atrioventricular Nodal Reentry Tachycardia Market, By Country
6.4.1.4 Rest of World Atrioventricular Nodal Reentry Tachycardia Market, By Country
6.5. Wolff-Parkinson-White Syndrome
6.5.1 Wolff-Parkinson-White Syndrome Market, By Region
6.5.1.1 North America Wolff-Parkinson-White Syndrome Market, By Country
6.5.1.2 Europe Wolff-Parkinson-White Syndrome Market, By Country
6.5.1.3 Asia-Pacific Wolff-Parkinson-White Syndrome Market, By Country
6.5.1.4 Rest of World Wolff-Parkinson-White Syndrome Market, By Country
6.6. Other Indication
6.6.1 Other Indication Market, By Region
6.6.1.1 North America Other Indication Market, By Country
6.6.1.2 Europe Other Indication Market, By Country
6.6.1.3 Asia-Pacific Other Indication Market, By Country
6.6.1.4 Rest of World Other Indication Market, By Country
7. Global Electrophysiology Market, By Region
7.1. Overview
7.2. North America
7.2.1 North America Electrophysiology Market, By Product
7.2.1.1 North America EP Ablation Catheters Market, By Product
7.2.1.2 North America EP Laboratory Devices Market, By Product
7.2.1.3 North America EP Diagnostic Catheters Market, By Product
7.2.2 North America Electrophysiology Market, By Indication
7.2.3 North America Electrophysiology, Market By Country
7.2.3.1 U.S
7.2.3.1.1 U.S Electrophysiology Market, By Product
7.2.3.1.1.1. U.S EP Ablation Catheters Market, By Product
7.2.3.1.1.2. U.S EP Laboratory Devices Market, By Product
7.2.3.1.1.3. U.S EP Diagnostic Catheters Market, By Product
7.2.3.1.2 U.S Electrophysiology Market, By Indication
7.2.3.2 Canada
7.2.3.2.1 Canada Electrophysiology Market, By Product
7.2.3.2.1.1. Canada EP Ablation Catheters Market, By Product
7.2.3.2.1.2. Canada EP Laboratory Devices Market, By Product
7.2.3.2.1.3. Canada EP Diagnostic Catheters Market, By Product
7.2.3.2.2 Canada Electrophysiology Market, By Indication
7.2.3.3 Mexico
7.2.3.3.1 Mexico Electrophysiology Market, By Product
7.2.3.3.1.1. Mexico EP Ablation Catheters Market, By Product
7.2.3.3.1.2. Mexico EP Laboratory Devices Market, By Product
7.2.3.3.1.3. Mexico EP Diagnostic Catheters Market, By Product
7.2.3.3.2 Mexico Electrophysiology Market, By Indication
7.3. Europe
7.3.1 Europe Electrophysiology Market, By Product
7.3.1.1 Europe EP Ablation Catheters Market, By Product
7.3.1.2 Europe EP Laboratory Devices Market, By Product
7.3.1.3 Europe EP Diagnostic Catheters Market, By Product
7.3.2 Europe Electrophysiology Market, By Indication
7.3.3 Europe Electrophysiology, Market By Country
7.3.3.1 Germany
7.3.3.1.1 Germany Electrophysiology Market, By Product
7.3.3.1.1.1. Germany EP Ablation Catheters Market, By Product
7.3.3.1.1.2. Germany EP Laboratory Devices Market, By Product
7.3.3.1.1.3. Germany EP Diagnostic Catheters Market, By Product
7.3.3.1.2 Germany Electrophysiology Market, By Indication
7.3.3.2 Italy
7.3.3.2.1 Italy Electrophysiology Market, By Product
7.3.3.2.1.1. Italy EP Ablation Catheters Market, By Product
7.3.3.2.1.2. Italy EP Laboratory Devices Market, By Product
7.3.3.2.1.3. Italy EP Diagnostic Catheters Market, By Product
7.3.3.2.2 Italy Electrophysiology Market, By Indication
7.3.3.3 UK
7.3.3.3.1 UK Electrophysiology Market, By Product
7.3.3.3.1.1. UK EP Ablation Catheters Market, By Product
7.3.3.3.1.2. UK EP Laboratory Devices Market, By Product
7.3.3.3.1.3. UK EP Diagnostic Catheters Market, By Product
7.3.3.3.2 UK Electrophysiology Market, By Indication
7.3.3.4 France
7.3.3.4.1 France Electrophysiology Market, By Product
7.3.3.4.1.1. France EP Ablation Catheters Market, By Product
7.3.3.4.1.2. France EP Laboratory Devices Market, By Product
7.3.3.4.1.3. France EP Diagnostic Catheters Market, By Product
7.3.3.4.2 France Electrophysiology Market, By Indication
7.3.3.5 Rest of Europe
7.3.3.5.1 Rest of Europe Electrophysiology Market, By Product
7.3.3.5.1.1. Rest of Europe EP Ablation Catheters Market, By Product
7.3.3.5.1.2. Rest of Europe EP Laboratory Devices Market, By Product
7.3.3.5.1.3. Rest of Europe EP Diagnostic Catheters Market, By Product
7.3.3.5.2 Rest of Europe Electrophysiology Market, By Indication
7.4. Asia-Pacific
7.4.1 Asia-Pacific Electrophysiology Market, By Product
7.4.1.1 Asia-Pacific EP Ablation Catheters Market, By Product
7.4.1.2 Asia-Pacific EP Laboratory Devices Market, By Product
7.4.1.3 Asia-Pacific EP Diagnostic Catheters Market, By Product
7.4.2 Asia-Pacific Electrophysiology Market, By Indication
7.4.3 Asia-Pacific Electrophysiology, Market By Country
7.4.3.1 Japan
7.4.3.1.1 Japan Electrophysiology Market, By Product
7.4.3.1.1.1. Japan EP Ablation Catheters Market, By Product
7.4.3.1.1.2. Japan EP Laboratory Devices Market, By Product
7.4.3.1.1.3. Japan EP Diagnostic Catheters Market, By Product
7.4.3.1.2 Japan Electrophysiology Market, By Indication
7.4.3.2 China
7.4.3.2.1 China Electrophysiology Market, By Product
7.4.3.2.1.1. China EP Ablation Catheters Market, By Product
7.4.3.2.1.2. China EP Laboratory Devices Market, By Product
7.4.3.2.1.3. China EP Diagnostic Catheters Market, By Product
7.4.3.2.2 China Electrophysiology Market, By Indication
7.4.3.3 Australia
7.4.3.3.1 Australia Electrophysiology Market, By Product
7.4.3.3.1.1. Australia EP Ablation Catheters Market, By Product
7.4.3.3.1.2. Australia EP Laboratory Devices Market, By Product
7.4.3.3.1.3. Australia EP Diagnostic Catheters Market, By Product
7.4.3.3.2 Australia Electrophysiology Market, By Indication
7.4.3.4 India
7.4.3.4.1 India Electrophysiology Market, By Product
7.4.3.4.1.1. India EP Ablation Catheters Market, By Product
7.4.3.4.1.2. India EP Laboratory Devices Market, By Product
7.4.3.4.1.3. India EP Diagnostic Catheters Market, By Product
7.4.3.4.2 India Electrophysiology Market, By Indication
7.4.3.5 Rest of Asia-Pacific
7.4.3.5.1 Rest of Asia-Pacific Electrophysiology Market, By Product
7.4.3.5.1.1. Rest of Asia-Pacific EP Ablation Catheters Market, By Product
7.4.3.5.1.2. Rest of Asia-Pacific EP Laboratory Devices Market, By Product
7.4.3.5.1.3. Rest of Asia-Pacific EP Diagnostic Catheters Market, By Product
7.4.3.5.2 Rest of Asia-Pacific Electrophysiology Market, By Indication
7.5. Rest of World
7.5.1 Rest of World Electrophysiology Market, By Product
7.5.1.1 Rest of World EP Ablation Catheters Market, By Product
7.5.1.2 Rest of World EP Laboratory Devices Market, By Product
7.5.1.3 Rest of World EP Diagnostic Catheters Market, By Product
7.5.2 Rest of World Electrophysiology Market, By Indication
7.5.3 Rest of World Electrophysiology, Market By Country
7.5.3.1 Brazil
7.5.3.1.1 Brazil Electrophysiology Market, By Product
7.5.3.1.1.1. Brazil EP Ablation Catheters Market, By Product
7.5.3.1.1.2. Brazil EP Laboratory Devices Market, By Product
7.5.3.1.1.3. Brazil EP Diagnostic Catheters Market, By Product
7.5.3.1.2 Brazil Electrophysiology Market, By Indication
7.5.3.2 Argentina
7.5.3.2.1 Argentina Electrophysiology Market, By Product
7.5.3.2.1.1. Argentina EP Ablation Catheters Market, By Product
7.5.3.2.1.2. Argentina EP Laboratory Devices Market, By Product
7.5.3.2.1.3. Argentina EP Diagnostic Catheters Market, By Product
7.5.3.2.2 Argentina Electrophysiology Market, By Indication
7.5.3.3 Egypt
7.5.3.3.1 Egypt Electrophysiology Market, By Product
7.5.3.3.1.1. Egypt EP Ablation Catheters Market, By Product
7.5.3.3.1.2. Egypt EP Laboratory Devices Market, By Product
7.5.3.3.1.3. Egypt EP Diagnostic Catheters Market, By Product
7.5.3.3.2 Egypt Electrophysiology Market, By Indication
7.5.3.4 Israel
7.5.3.4.1 Israel Electrophysiology Market, By Product
7.5.3.4.1.1. Israel EP Ablation Catheters Market, By Product
7.5.3.4.1.2. Israel EP Laboratory Devices Market, By Product
7.5.3.4.1.3. Israel EP Diagnostic Catheters Market, By Product
7.5.3.4.2 Israel Electrophysiology Market, By Indication
7.5.3.5 South Africa
7.5.3.5.1 South Africa Electrophysiology Market, By Product
7.5.3.5.1.1. South Africa EP Ablation Catheters Market, By Product
7.5.3.5.1.2. South Africa EP Laboratory Devices Market, By Product
7.5.3.5.1.3. South Africa EP Diagnostic Catheters Market, By Product
7.5.3.5.2 South Africa Electrophysiology Market, By Indication
8. COMPANY PROFILES
8.1. Abbott Laboratories
8.1.1 COMPANY OVERVIEW
8.1.2 COMPANY SNAPSHOT
8.1.3 OPERATING BUSINESS SEGMENTS
8.1.4 PRODUCT PORTFOLIO
8.1.5 BUSINESS PERFORMANCE
8.1.6 KEY STRATEGIC MOVES AND DEVELOPMENT
8.2. Johnson & Johnson
8.2.1 COMPANY OVERVIEW
8.2.2 COMPANY SNAPSHOT
8.2.3 OPERATING BUSINESS SEGMENTS
8.2.4 PRODUCT PORTFOLIO
8.2.5 BUSINESS PERFORMANCE
8.2.6 KEY STRATEGIC MOVES AND DEVELOPMENT
8.3. Microport Scientific Corporation
8.3.1 COMPANY OVERVIEW
8.3.2 COMPANY SNAPSHOT
8.3.3 OPERATING BUSINESS SEGMENTS
8.3.4 PRODUCT PORTFOLIO
8.3.5 BUSINESS PERFORMANCE
8.3.6 KEY STRATEGIC MOVES AND DEVELOPMENT
8.4. Boston Scientific Corporation
8.4.1 COMPANY OVERVIEW
8.4.2 COMPANY SNAPSHOT
8.4.3 OPERATING BUSINESS SEGMENTS
8.4.4 PRODUCT PORTFOLIO
8.4.5 BUSINESS PERFORMANCE
8.4.6 KEY STRATEGIC MOVES AND DEVELOPMENT
8.5. St. Jude Medical, Inc.
8.5.1 COMPANY OVERVIEW
8.5.2 COMPANY SNAPSHOT
8.5.3 OPERATING BUSINESS SEGMENTS
8.5.4 PRODUCT PORTFOLIO
8.5.5 BUSINESS PERFORMANCE
8.5.6 KEY STRATEGIC MOVES AND DEVELOPMENT
8.6. Medtronic plc
8.6.1 COMPANY OVERVIEW
8.6.2 COMPANY SNAPSHOT
8.6.3 OPERATING BUSINESS SEGMENTS
8.6.4 PRODUCT PORTFOLIO
8.6.5 BUSINESS PERFORMANCE
8.6.6 KEY STRATEGIC MOVES AND DEVELOPMENT
8.7. Biotronik SE & Co. KG
8.7.1 COMPANY OVERVIEW
8.7.2 COMPANY SNAPSHOT
8.7.3 OPERATING BUSINESS SEGMENTS
8.7.4 PRODUCT PORTFOLIO
8.7.5 BUSINESS PERFORMANCE
8.7.6 KEY STRATEGIC MOVES AND DEVELOPMENT
8.8. Koninklijke Philips N.V.
8.8.1 COMPANY OVERVIEW
8.8.2 COMPANY SNAPSHOT
8.8.3 OPERATING BUSINESS SEGMENTS
8.8.4 PRODUCT PORTFOLIO
8.8.5 BUSINESS PERFORMANCE
8.8.6 KEY STRATEGIC MOVES AND DEVELOPMENT
8.9. General Electric Co.
8.9.1 COMPANY OVERVIEW
8.9.2 COMPANY SNAPSHOT
8.9.3 OPERATING BUSINESS SEGMENTS
8.9.4 PRODUCT PORTFOLIO
8.9.5 BUSINESS PERFORMANCE
8.9.6 KEY STRATEGIC MOVES AND DEVELOPMENT
8.10. Siemens AG
8.10.1 COMPANY OVERVIEW
8.10.2 COMPANY SNAPSHOT
8.10.3 OPERATING BUSINESS SEGMENTS
8.10.4 PRODUCT PORTFOLIO
8.10.5 BUSINESS PERFORMANCE
8.10.6 KEY STRATEGIC MOVES AND DEVELOPMENT
LIST OF TABLES
TABLE 1. Global Electrophysiology Market Value, By Product, 2019-2030, Million USD
TABLE 2. Global EP Ablation Catheters Market Value, By Product, 2019-2030, Million USD
TABLE 3. Cryoablation EP Catheters Market Value, By Region, 2019-2030, Million USD
TABLE 4. North America Cryoablation EP Catheters Market Value, By Country, 2019-2030, Million USD
TABLE 5. Europe Cryoablation EP Catheters Market Value, By Country, 2019-2030, Million USD
TABLE 6. Asia-Pacific Cryoablation EP Catheters Market Value, By Country, 2019-2030, Million USD
TABLE 7. Rest of World Cryoablation EP Catheters Market Value, By Country, 2019-2030, Million USD
TABLE 8. Radiofrequency (RF) Ablation Catheters Market Value, By Region, 2019-2030, Million USD
TABLE 9. North America Radiofrequency (RF) Ablation Catheters Market Value, By Country, 2019-2030, Million USD
TABLE 10. Europe Radiofrequency (RF) Ablation Catheters Market Value, By Country, 2019-2030, Million USD
TABLE 11. Asia-Pacific Radiofrequency (RF) Ablation Catheters Market Value, By Country, 2019-2030, Million USD
TABLE 12. Rest of World Radiofrequency (RF) Ablation Catheters Market Value, By Country, 2019-2030, Million USD
TABLE 13. Irrigated-tip RF Ablation Catheters Market Value, By Region, 2019-2030, Million USD
TABLE 14. North America Irrigated-tip RF Ablation Catheters Market Value, By Country, 2019-2030, Million USD
TABLE 15. Europe Irrigated-tip RF Ablation Catheters Market Value, By Country, 2019-2030, Million USD
TABLE 16. Asia-Pacific Irrigated-tip RF Ablation Catheters Market Value, By Country, 2019-2030, Million USD
TABLE 17. Rest of World Irrigated-tip RF Ablation Catheters Market Value, By Country, 2019-2030, Million USD
TABLE 18. Microwave Ablation (MWA) Systems Market Value, By Region, 2019-2030, Million USD
TABLE 19. North America Microwave Ablation (MWA) Systems Market Value, By Country, 2019-2030, Million USD
TABLE 20. Europe Microwave Ablation (MWA) Systems Market Value, By Country, 2019-2030, Million USD
TABLE 21. Asia-Pacific Microwave Ablation (MWA) Systems Market Value, By Country, 2019-2030, Million USD
TABLE 22. Rest of World Microwave Ablation (MWA) Systems Market Value, By Country, 2019-2030, Million USD
TABLE 23. Laser Ablation Systems Market Value, By Region, 2019-2030, Million USD
TABLE 24. North America Laser Ablation Systems Market Value, By Country, 2019-2030, Million USD
TABLE 25. Europe Laser Ablation Systems Market Value, By Country, 2019-2030, Million USD
TABLE 26. Asia-Pacific Laser Ablation Systems Market Value, By Country, 2019-2030, Million USD
TABLE 27. Rest of World Laser Ablation Systems Market Value, By Country, 2019-2030, Million USD
TABLE 28. Navigational Advanced Mapping Accessories Market Value, By Region, 2019-2030, Million USD
TABLE 29. North America Navigational Advanced Mapping Accessories Market Value, By Country, 2019-2030, Million USD
TABLE 30. Europe Navigational Advanced Mapping Accessories Market Value, By Country, 2019-2030, Million USD
TABLE 31. Asia-Pacific Navigational Advanced Mapping Accessories Market Value, By Country, 2019-2030, Million USD
TABLE 32. Rest of World Navigational Advanced Mapping Accessories Market Value, By Country, 2019-2030, Million USD
TABLE 33. EP Ablation Catheters Market Value, By Region, 2019-2030, Million USD
TABLE 34. North America EP Ablation Catheters Market Value, By Country, 2019-2030, Million USD
TABLE 35. Europe EP Ablation Catheters Market Value, By Country, 2019-2030, Million USD
TABLE 36. Asia-Pacific EP Ablation Catheters Market Value, By Country, 2019-2030, Million USD
TABLE 37. Rest of World EP Ablation Catheters Market Value, By Country, 2019-2030, Million USD
TABLE 38. Global EP Laboratory Devices Market Value, By Product, 2019-2030, Million USD
TABLE 39. 3D mapping systems Market Value, By Region, 2019-2030, Million USD
TABLE 40. North America 3D mapping systems Market Value, By Country, 2019-2030, Million USD
TABLE 41. Europe 3D mapping systems Market Value, By Country, 2019-2030, Million USD
TABLE 42. Asia-Pacific 3D mapping systems Market Value, By Country, 2019-2030, Million USD
TABLE 43. Rest of World 3D mapping systems Market Value, By Country, 2019-2030, Million USD
TABLE 44. EP recording systems Market Value, By Region, 2019-2030, Million USD
TABLE 45. North America EP recording systems Market Value, By Country, 2019-2030, Million USD
TABLE 46. Europe EP recording systems Market Value, By Country, 2019-2030, Million USD
TABLE 47. Asia-Pacific EP recording systems Market Value, By Country, 2019-2030, Million USD
TABLE 48. Rest of World EP recording systems Market Value, By Country, 2019-2030, Million USD
TABLE 49. EP X-Ray systems Market Value, By Region, 2019-2030, Million USD
TABLE 50. North America EP X-Ray systems Market Value, By Country, 2019-2030, Million USD
TABLE 51. Europe EP X-Ray systems Market Value, By Country, 2019-2030, Million USD
TABLE 52. Asia-Pacific EP X-Ray systems Market Value, By Country, 2019-2030, Million USD
TABLE 53. Rest of World EP X-Ray systems Market Value, By Country, 2019-2030, Million USD
TABLE 54. EP remote steering systems Market Value, By Region, 2019-2030, Million USD
TABLE 55. North America EP remote steering systems Market Value, By Country, 2019-2030, Million USD
TABLE 56. Europe EP remote steering systems Market Value, By Country, 2019-2030, Million USD
TABLE 57. Asia-Pacific EP remote steering systems Market Value, By Country, 2019-2030, Million USD
TABLE 58. Rest of World EP remote steering systems Market Value, By Country, 2019-2030, Million USD
TABLE 59. Other EP Laboratory Devices Market Value, By Region, 2019-2030, Million USD
TABLE 60. North America Other EP Laboratory Devices Market Value, By Country, 2019-2030, Million USD
TABLE 61. Europe Other EP Laboratory Devices Market Value, By Country, 2019-2030, Million USD
TABLE 62. Asia-Pacific Other EP Laboratory Devices Market Value, By Country, 2019-2030, Million USD
TABLE 63. Rest of World Other EP Laboratory Devices Market Value, By Country, 2019-2030, Million USD
TABLE 64. EP Laboratory Devices Market Value, By Region, 2019-2030, Million USD
TABLE 65. North America EP Laboratory Devices Market Value, By Country, 2019-2030, Million USD
TABLE 66. Europe EP Laboratory Devices Market Value, By Country, 2019-2030, Million USD
TABLE 67. Asia-Pacific EP Laboratory Devices Market Value, By Country, 2019-2030, Million USD
TABLE 68. Rest of World EP Laboratory Devices Market Value, By Country, 2019-2030, Million USD
TABLE 69. Global EP Diagnostic Catheters Market Value, By Product, 2019-2030, Million USD
TABLE 70. Conventional EP Diagnostic Catheters Market Value, By Region, 2019-2030, Million USD
TABLE 71. North America Conventional EP Diagnostic Catheters Market Value, By Country, 2019-2030, Million USD
TABLE 72. Europe Conventional EP Diagnostic Catheters Market Value, By Country, 2019-2030, Million USD
TABLE 73. Asia-Pacific Conventional EP Diagnostic Catheters Market Value, By Country, 2019-2030, Million USD
TABLE 74. Rest of World Conventional EP Diagnostic Catheters Market Value, By Country, 2019-2030, Million USD
TABLE 75. Advanced EP Diagnostic Catheters Market Value, By Region, 2019-2030, Million USD
TABLE 76. North America Advanced EP Diagnostic Catheters Market Value, By Country, 2019-2030, Million USD
TABLE 77. Europe Advanced EP Diagnostic Catheters Market Value, By Country, 2019-2030, Million USD
TABLE 78. Asia-Pacific Advanced EP Diagnostic Catheters Market Value, By Country, 2019-2030, Million USD
TABLE 79. Rest of World Advanced EP Diagnostic Catheters Market Value, By Country, 2019-2030, Million USD
TABLE 80. Ultrasound EP Diagnostic Catheters Market Value, By Region, 2019-2030, Million USD
TABLE 81. North America Ultrasound EP Diagnostic Catheters Market Value, By Country, 2019-2030, Million USD
TABLE 82. Europe Ultrasound EP Diagnostic Catheters Market Value, By Country, 2019-2030, Million USD
TABLE 83. Asia-Pacific Ultrasound EP Diagnostic Catheters Market Value, By Country, 2019-2030, Million USD
TABLE 84. Rest of World Ultrasound EP Diagnostic Catheters Market Value, By Country, 2019-2030, Million USD
TABLE 85. EP Diagnostic Catheters Market Value, By Region, 2019-2030, Million USD
TABLE 86. North America EP Diagnostic Catheters Market Value, By Country, 2019-2030, Million USD
TABLE 87. Europe EP Diagnostic Catheters Market Value, By Country, 2019-2030, Million USD
TABLE 88. Asia-Pacific EP Diagnostic Catheters Market Value, By Country, 2019-2030, Million USD
TABLE 89. Rest of World EP Diagnostic Catheters Market Value, By Country, 2019-2030, Million USD
TABLE 90. Access Devices Market Value, By Region, 2019-2030, Million USD
TABLE 91. North America Access Devices Market Value, By Country, 2019-2030, Million USD
TABLE 92. Europe Access Devices Market Value, By Country, 2019-2030, Million USD
TABLE 93. Asia-Pacific Access Devices Market Value, By Country, 2019-2030, Million USD
TABLE 94. Rest of World Access Devices Market Value, By Country, 2019-2030, Million USD
TABLE 95. Global Electrophysiology Market Value, By Indication, 2019-2030, Million USD
TABLE 96. Atrial Fibrillation Market Value, By Region, 2019-2030, Million USD
TABLE 97. North America Atrial Fibrillation Market Value, By Country, 2019-2030, Million USD
TABLE 98. Europe Atrial Fibrillation Market Value, By Country, 2019-2030, Million USD
TABLE 99. Asia-Pacific Atrial Fibrillation Market Value, By Country, 2019-2030, Million USD
TABLE 100. Rest of World Atrial Fibrillation Market Value, By Country, 2019-2030, Million USD
TABLE 101. Atrial Flutter Market Value, By Region, 2019-2030, Million USD
TABLE 102. North America Atrial Flutter Market Value, By Country, 2019-2030, Million USD
TABLE 103. Europe Atrial Flutter Market Value, By Country, 2019-2030, Million USD
TABLE 104. Asia-Pacific Atrial Flutter Market Value, By Country, 2019-2030, Million USD
TABLE 105. Rest of World Atrial Flutter Market Value, By Country, 2019-2030, Million USD
TABLE 106. Atrioventricular Nodal Reentry Tachycardia Market Value, By Region, 2019-2030, Million USD
TABLE 107. North America Atrioventricular Nodal Reentry Tachycardia Market Value, By Country, 2019-2030, Million USD
TABLE 108. Europe Atrioventricular Nodal Reentry Tachycardia Market Value, By Country, 2019-2030, Million USD
TABLE 109. Asia-Pacific Atrioventricular Nodal Reentry Tachycardia Market Value, By Country, 2019-2030, Million USD
TABLE 110. Rest of World Atrioventricular Nodal Reentry Tachycardia Market Value, By Country, 2019-2030, Million USD
TABLE 111. Wolff-Parkinson-White Syndrome Market Value, By Region, 2019-2030, Million USD
TABLE 112. North America Wolff-Parkinson-White Syndrome Market Value, By Country, 2019-2030, Million USD
TABLE 113. Europe Wolff-Parkinson-White Syndrome Market Value, By Country, 2019-2030, Million USD
TABLE 114. Asia-Pacific Wolff-Parkinson-White Syndrome Market Value, By Country, 2019-2030, Million USD
TABLE 115. Rest of World Wolff-Parkinson-White Syndrome Market Value, By Country, 2019-2030, Million USD
TABLE 116. Other Indication Market Value, By Region, 2019-2030, Million USD
TABLE 117. North America Other Indication Market Value, By Country, 2019-2030, Million USD
TABLE 118. Europe Other Indication Market Value, By Country, 2019-2030, Million USD
TABLE 119. Asia-Pacific Other Indication Market Value, By Country, 2019-2030, Million USD
TABLE 120. Rest of World Other Indication Market Value, By Country, 2019-2030, Million USD
TABLE 121. Global Electrophysiology Market Value, By Region, 2019-2030, Million USD
TABLE 122. North America Electrophysiology Market Value, By Product, 2019-2030, Million USD
TABLE 123. North America EP Ablation Catheters Market Value, By Product, 2019-2030, Million USD
TABLE 124. North America EP Laboratory Devices Market Value, By Product, 2019-2030, Million USD
TABLE 125. North America EP Diagnostic Catheters Market Value, By Product, 2019-2030, Million USD
TABLE 126. North America Electrophysiology Market Value, By Indication, 2019-2030, Million USD
TABLE 127. U.S Electrophysiology Market Value, By Product, 2019-2030, Million USD
TABLE 128. U.S EP Ablation Catheters Market Value, By Product, 2019-2030, Million USD
TABLE 129. U.S EP Laboratory Devices Market Value, By Product, 2019-2030, Million USD
TABLE 130. U.S EP Diagnostic Catheters Market Value, By Product, 2019-2030, Million USD
TABLE 131. U.S Electrophysiology Market Value, By Indication, 2019-2030, Million USD
TABLE 132. Canada Electrophysiology Market Value, By Product, 2019-2030, Million USD
TABLE 133. Canada EP Ablation Catheters Market Value, By Product, 2019-2030, Million USD
TABLE 134. Canada EP Laboratory Devices Market Value, By Product, 2019-2030, Million USD
TABLE 135. Canada EP Diagnostic Catheters Market Value, By Product, 2019-2030, Million USD
TABLE 136. Canada Electrophysiology Market Value, By Indication, 2019-2030, Million USD
TABLE 137. Mexico Electrophysiology Market Value, By Product, 2019-2030, Million USD
TABLE 138. Mexico EP Ablation Catheters Market Value, By Product, 2019-2030, Million USD
TABLE 139. Mexico EP Laboratory Devices Market Value, By Product, 2019-2030, Million USD
TABLE 140. Mexico EP Diagnostic Catheters Market Value, By Product, 2019-2030, Million USD
TABLE 141. Mexico Electrophysiology Market Value, By Indication, 2019-2030, Million USD
TABLE 142. Europe Electrophysiology Market Value, By Product, 2019-2030, Million USD
TABLE 143. Europe EP Ablation Catheters Market Value, By Product, 2019-2030, Million USD
TABLE 144. Europe EP Laboratory Devices Market Value, By Product, 2019-2030, Million USD
TABLE 145. Europe EP Diagnostic Catheters Market Value, By Product, 2019-2030, Million USD
TABLE 146. Europe Electrophysiology Market Value, By Indication, 2019-2030, Million USD
TABLE 147. Germany Electrophysiology Market Value, By Product, 2019-2030, Million USD
TABLE 148. Germany EP Ablation Catheters Market Value, By Product, 2019-2030, Million USD
TABLE 149. Germany EP Laboratory Devices Market Value, By Product, 2019-2030, Million USD
TABLE 150. Germany EP Diagnostic Catheters Market Value, By Product, 2019-2030, Million USD
TABLE 151. Germany Electrophysiology Market Value, By Indication, 2019-2030, Million USD
TABLE 152. Italy Electrophysiology Market Value, By Product, 2019-2030, Million USD
TABLE 153. Italy EP Ablation Catheters Market Value, By Product, 2019-2030, Million USD
TABLE 154. Italy EP Laboratory Devices Market Value, By Product, 2019-2030, Million USD
TABLE 155. Italy EP Diagnostic Catheters Market Value, By Product, 2019-2030, Million USD
TABLE 156. Italy Electrophysiology Market Value, By Indication, 2019-2030, Million USD
TABLE 157. UK Electrophysiology Market Value, By Product, 2019-2030, Million USD
TABLE 158. UK EP Ablation Catheters Market Value, By Product, 2019-2030, Million USD
TABLE 159. UK EP Laboratory Devices Market Value, By Product, 2019-2030, Million USD
TABLE 160. UK EP Diagnostic Catheters Market Value, By Product, 2019-2030, Million USD
TABLE 161. UK Electrophysiology Market Value, By Indication, 2019-2030, Million USD
TABLE 162. France Electrophysiology Market Value, By Product, 2019-2030, Million USD
TABLE 163. France EP Ablation Catheters Market Value, By Product, 2019-2030, Million USD
TABLE 164. France EP Laboratory Devices Market Value, By Product, 2019-2030, Million USD
TABLE 165. France EP Diagnostic Catheters Market Value, By Product, 2019-2030, Million USD
TABLE 166. France Electrophysiology Market Value, By Indication, 2019-2030, Million USD
TABLE 167. Rest of Europe Electrophysiology Market Value, By Product, 2019-2030, Million USD
TABLE 168. Rest of Europe EP Ablation Catheters Market Value, By Product, 2019-2030, Million USD
TABLE 169. Rest of Europe EP Laboratory Devices Market Value, By Product, 2019-2030, Million USD
TABLE 170. Rest of Europe EP Diagnostic Catheters Market Value, By Product, 2019-2030, Million USD
TABLE 171. Rest of Europe Electrophysiology Market Value, By Indication, 2019-2030, Million USD
TABLE 172. Asia-Pacific Electrophysiology Market Value, By Product, 2019-2030, Million USD
TABLE 173. Asia-Pacific EP Ablation Catheters Market Value, By Product, 2019-2030, Million USD
TABLE 174. Asia-Pacific EP Laboratory Devices Market Value, By Product, 2019-2030, Million USD
TABLE 175. Asia-Pacific EP Diagnostic Catheters Market Value, By Product, 2019-2030, Million USD
TABLE 176. Asia-Pacific Electrophysiology Market Value, By Indication, 2019-2030, Million USD
TABLE 177. Japan Electrophysiology Market Value, By Product, 2019-2030, Million USD
TABLE 178. Japan EP Ablation Catheters Market Value, By Product, 2019-2030, Million USD
TABLE 179. Japan EP Laboratory Devices Market Value, By Product, 2019-2030, Million USD
TABLE 180. Japan EP Diagnostic Catheters Market Value, By Product, 2019-2030, Million USD
TABLE 181. Japan Electrophysiology Market Value, By Indication, 2019-2030, Million USD
TABLE 182. China Electrophysiology Market Value, By Product, 2019-2030, Million USD
TABLE 183. China EP Ablation Catheters Market Value, By Product, 2019-2030, Million USD
TABLE 184. China EP Laboratory Devices Market Value, By Product, 2019-2030, Million USD
TABLE 185. China EP Diagnostic Catheters Market Value, By Product, 2019-2030, Million USD
TABLE 186. China Electrophysiology Market Value, By Indication, 2019-2030, Million USD
TABLE 187. Australia Electrophysiology Market Value, By Product, 2019-2030, Million USD
TABLE 188. Australia EP Ablation Catheters Market Value, By Product, 2019-2030, Million USD
TABLE 189. Australia EP Laboratory Devices Market Value, By Product, 2019-2030, Million USD
TABLE 190. Australia EP Diagnostic Catheters Market Value, By Product, 2019-2030, Million USD
TABLE 191. Australia Electrophysiology Market Value, By Indication, 2019-2030, Million USD
TABLE 192. India Electrophysiology Market Value, By Product, 2019-2030, Million USD
TABLE 193. India EP Ablation Catheters Market Value, By Product, 2019-2030, Million USD
TABLE 194. India EP Laboratory Devices Market Value, By Product, 2019-2030, Million USD
TABLE 195. India EP Diagnostic Catheters Market Value, By Product, 2019-2030, Million USD
TABLE 196. India Electrophysiology Market Value, By Indication, 2019-2030, Million USD
TABLE 197. Rest of Asia-Pacific Electrophysiology Market Value, By Product, 2019-2030, Million USD
TABLE 198. Rest of Asia-Pacific EP Ablation Catheters Market Value, By Product, 2019-2030, Million USD
TABLE 199. Rest of Asia-Pacific EP Laboratory Devices Market Value, By Product, 2019-2030, Million USD
TABLE 200. Rest of Asia-Pacific EP Diagnostic Catheters Market Value, By Product, 2019-2030, Million USD
TABLE 201. Rest of Asia-Pacific Electrophysiology Market Value, By Indication, 2019-2030, Million USD
TABLE 202. Rest of World Electrophysiology Market Value, By Product, 2019-2030, Million USD
TABLE 203. Rest of World EP Ablation Catheters Market Value, By Product, 2019-2030, Million USD
TABLE 204. Rest of World EP Laboratory Devices Market Value, By Product, 2019-2030, Million USD
TABLE 205. Rest of World EP Diagnostic Catheters Market Value, By Product, 2019-2030, Million USD
TABLE 206. Rest of World Electrophysiology Market Value, By Indication, 2019-2030, Million USD
TABLE 207. Brazil Electrophysiology Market Value, By Product, 2019-2030, Million USD
TABLE 208. Brazil EP Ablation Catheters Market Value, By Product, 2019-2030, Million USD
TABLE 209. Brazil EP Laboratory Devices Market Value, By Product, 2019-2030, Million USD
TABLE 210. Brazil EP Diagnostic Catheters Market Value, By Product, 2019-2030, Million USD
TABLE 211. Brazil Electrophysiology Market Value, By Indication, 2019-2030, Million USD
TABLE 212. Argentina Electrophysiology Market Value, By Product, 2019-2030, Million USD
TABLE 213. Argentina EP Ablation Catheters Market Value, By Product, 2019-2030, Million USD
TABLE 214. Argentina EP Laboratory Devices Market Value, By Product, 2019-2030, Million USD
TABLE 215. Argentina EP Diagnostic Catheters Market Value, By Product, 2019-2030, Million USD
TABLE 216. Argentina Electrophysiology Market Value, By Indication, 2019-2030, Million USD
TABLE 217. Egypt Electrophysiology Market Value, By Product, 2019-2030, Million USD
TABLE 218. Egypt EP Ablation Catheters Market Value, By Product, 2019-2030, Million USD
TABLE 219. Egypt EP Laboratory Devices Market Value, By Product, 2019-2030, Million USD
TABLE 220. Egypt EP Diagnostic Catheters Market Value, By Product, 2019-2030, Million USD
TABLE 221. Egypt Electrophysiology Market Value, By Indication, 2019-2030, Million USD
TABLE 222. Israel Electrophysiology Market Value, By Product, 2019-2030, Million USD
TABLE 223. Israel EP Ablation Catheters Market Value, By Product, 2019-2030, Million USD
TABLE 224. Israel EP Laboratory Devices Market Value, By Product, 2019-2030, Million USD
TABLE 225. Israel EP Diagnostic Catheters Market Value, By Product, 2019-2030, Million USD
TABLE 226. Israel Electrophysiology Market Value, By Indication, 2019-2030, Million USD
TABLE 227. South Africa Electrophysiology Market Value, By Product, 2019-2030, Million USD
TABLE 228. South Africa EP Ablation Catheters Market Value, By Product, 2019-2030, Million USD
TABLE 229. South Africa EP Laboratory Devices Market Value, By Product, 2019-2030, Million USD
TABLE 230. South Africa EP Diagnostic Catheters Market Value, By Product, 2019-2030, Million USD
TABLE 231. South Africa Electrophysiology Market Value, By Indication, 2019-2030, Million USD
TABLE 232. Abbott Laboratories: COMPANY SNAPSHOT
TABLE 233. Abbott Laboratories: OPERATING SEGMENTS
TABLE 234. Abbott Laboratories: PRODUCT PORTFOLIO
TABLE 235. Abbott Laboratories: KEY STRATERGY
TABLE 236. Johnson & Johnson: COMPANY SNAPSHOT
TABLE 237. Johnson & Johnson: OPERATING SEGMENTS
TABLE 238. Johnson & Johnson: PRODUCT PORTFOLIO
TABLE 239. Johnson & Johnson: KEY STRATERGY
TABLE 240. Microport Scientific Corporation: COMPANY SNAPSHOT
TABLE 241. Microport Scientific Corporation: OPERATING SEGMENTS
TABLE 242. Microport Scientific Corporation: PRODUCT PORTFOLIO
TABLE 243. Microport Scientific Corporation: KEY STRATERGY
TABLE 244. Boston Scientific Corporation: COMPANY SNAPSHOT
TABLE 245. Boston Scientific Corporation: OPERATING SEGMENTS
TABLE 246. Boston Scientific Corporation: PRODUCT PORTFOLIO
TABLE 247. Boston Scientific Corporation: KEY STRATERGY
TABLE 248. St. Jude Medical, Inc.: COMPANY SNAPSHOT
TABLE 249. St. Jude Medical, Inc.: OPERATING SEGMENTS
TABLE 250. St. Jude Medical, Inc.: PRODUCT PORTFOLIO
TABLE 251. St. Jude Medical, Inc.: KEY STRATERGY
TABLE 252. Medtronic plc: COMPANY SNAPSHOT
TABLE 253. Medtronic plc: OPERATING SEGMENTS
TABLE 254. Medtronic plc: PRODUCT PORTFOLIO
TABLE 255. Medtronic plc: KEY STRATERGY
TABLE 256. Biotronik SE & Co. KG: COMPANY SNAPSHOT
TABLE 257. Biotronik SE & Co. KG: OPERATING SEGMENTS
TABLE 258. Biotronik SE & Co. KG: PRODUCT PORTFOLIO
TABLE 259. Biotronik SE & Co. KG: KEY STRATERGY
TABLE 260. Koninklijke Philips N.V.: COMPANY SNAPSHOT
TABLE 261. Koninklijke Philips N.V.: OPERATING SEGMENTS
TABLE 262. Koninklijke Philips N.V.: PRODUCT PORTFOLIO
TABLE 263. Koninklijke Philips N.V.: KEY STRATERGY
TABLE 264. General Electric Co.: COMPANY SNAPSHOT
TABLE 265. General Electric Co.: OPERATING SEGMENTS
TABLE 266. General Electric Co.: PRODUCT PORTFOLIO
TABLE 267. General Electric Co.: KEY STRATERGY
TABLE 268. Siemens AG: COMPANY SNAPSHOT
TABLE 269. Siemens AG: OPERATING SEGMENTS
TABLE 270. Siemens AG: PRODUCT PORTFOLIO
TABLE 271. Siemens AG: KEY STRATERGY
LIST OF FIGURES
FIGURE 1. Global Electrophysiology Market Value, By Product, 2019-2030, Million USD
FIGURE 2. Global EP Ablation Catheters Market Value, By Product, 2019-2030, Million USD
FIGURE 3. Cryoablation EP Catheters Market Value, By Region, 2019-2030, Million USD
FIGURE 4. North America Cryoablation EP Catheters Market Value, By Country, 2019-2030, Million USD
FIGURE 5. Europe Cryoablation EP Catheters Market Value, By Country, 2019-2030, Million USD
FIGURE 6. Asia-Pacific Cryoablation EP Catheters Market Value, By Country, 2019-2030, Million USD
FIGURE 7. Rest of World Cryoablation EP Catheters Market Value, By Country, 2019-2030, Million USD
FIGURE 8. Radiofrequency (RF) Ablation Catheters Market Value, By Region, 2019-2030, Million USD
FIGURE 9. North America Radiofrequency (RF) Ablation Catheters Market Value, By Country, 2019-2030, Million USD
FIGURE 10. Europe Radiofrequency (RF) Ablation Catheters Market Value, By Country, 2019-2030, Million USD
FIGURE 11. Asia-Pacific Radiofrequency (RF) Ablation Catheters Market Value, By Country, 2019-2030, Million USD
FIGURE 12. Rest of World Radiofrequency (RF) Ablation Catheters Market Value, By Country, 2019-2030, Million USD
FIGURE 13. Irrigated-tip RF Ablation Catheters Market Value, By Region, 2019-2030, Million USD
FIGURE 14. North America Irrigated-tip RF Ablation Catheters Market Value, By Country, 2019-2030, Million USD
FIGURE 15. Europe Irrigated-tip RF Ablation Catheters Market Value, By Country, 2019-2030, Million USD
FIGURE 16. Asia-Pacific Irrigated-tip RF Ablation Catheters Market Value, By Country, 2019-2030, Million USD
FIGURE 17. Rest of World Irrigated-tip RF Ablation Catheters Market Value, By Country, 2019-2030, Million USD
FIGURE 18. Microwave Ablation (MWA) Systems Market Value, By Region, 2019-2030, Million USD
FIGURE 19. North America Microwave Ablation (MWA) Systems Market Value, By Country, 2019-2030, Million USD
FIGURE 20. Europe Microwave Ablation (MWA) Systems Market Value, By Country, 2019-2030, Million USD
FIGURE 21. Asia-Pacific Microwave Ablation (MWA) Systems Market Value, By Country, 2019-2030, Million USD
FIGURE 22. Rest of World Microwave Ablation (MWA) Systems Market Value, By Country, 2019-2030, Million USD
FIGURE 23. Laser Ablation Systems Market Value, By Region, 2019-2030, Million USD
FIGURE 24. North America Laser Ablation Systems Market Value, By Country, 2019-2030, Million USD
FIGURE 25. Europe Laser Ablation Systems Market Value, By Country, 2019-2030, Million USD
FIGURE 26. Asia-Pacific Laser Ablation Systems Market Value, By Country, 2019-2030, Million USD
FIGURE 27. Rest of World Laser Ablation Systems Market Value, By Country, 2019-2030, Million USD
FIGURE 28. Navigational Advanced Mapping Accessories Market Value, By Region, 2019-2030, Million USD
FIGURE 29. North America Navigational Advanced Mapping Accessories Market Value, By Country, 2019-2030, Million USD
FIGURE 30. Europe Navigational Advanced Mapping Accessories Market Value, By Country, 2019-2030, Million USD
FIGURE 31. Asia-Pacific Navigational Advanced Mapping Accessories Market Value, By Country, 2019-2030, Million USD
FIGURE 32. Rest of World Navigational Advanced Mapping Accessories Market Value, By Country, 2019-2030, Million USD
FIGURE 33. EP Ablation Catheters Market Value, By Region, 2019-2030, Million USD
FIGURE 34. North America EP Ablation Catheters Market Value, By Country, 2019-2030, Million USD
FIGURE 35. Europe EP Ablation Catheters Market Value, By Country, 2019-2030, Million USD
FIGURE 36. Asia-Pacific EP Ablation Catheters Market Value, By Country, 2019-2030, Million USD
FIGURE 37. Rest of World EP Ablation Catheters Market Value, By Country, 2019-2030, Million USD
FIGURE 38. Global EP Laboratory Devices Market Value, By Product, 2019-2030, Million USD
FIGURE 39. 3D mapping systems Market Value, By Region, 2019-2030, Million USD
FIGURE 40. North America 3D mapping systems Market Value, By Country, 2019-2030, Million USD
FIGURE 41. Europe 3D mapping systems Market Value, By Country, 2019-2030, Million USD
FIGURE 42. Asia-Pacific 3D mapping systems Market Value, By Country, 2019-2030, Million USD
FIGURE 43. Rest of World 3D mapping systems Market Value, By Country, 2019-2030, Million USD
FIGURE 44. EP recording systems Market Value, By Region, 2019-2030, Million USD
FIGURE 45. North America EP recording systems Market Value, By Country, 2019-2030, Million USD
FIGURE 46. Europe EP recording systems Market Value, By Country, 2019-2030, Million USD
FIGURE 47. Asia-Pacific EP recording systems Market Value, By Country, 2019-2030, Million USD
FIGURE 48. Rest of World EP recording systems Market Value, By Country, 2019-2030, Million USD
FIGURE 49. EP X-Ray systems Market Value, By Region, 2019-2030, Million USD
FIGURE 50. North America EP X-Ray systems Market Value, By Country, 2019-2030, Million USD
FIGURE 51. Europe EP X-Ray systems Market Value, By Country, 2019-2030, Million USD
FIGURE 52. Asia-Pacific EP X-Ray systems Market Value, By Country, 2019-2030, Million USD
FIGURE 53. Rest of World EP X-Ray systems Market Value, By Country, 2019-2030, Million USD
FIGURE 54. EP remote steering systems Market Value, By Region, 2019-2030, Million USD
FIGURE 55. North America EP remote steering systems Market Value, By Country, 2019-2030, Million USD
FIGURE 56. Europe EP remote steering systems Market Value, By Country, 2019-2030, Million USD
FIGURE 57. Asia-Pacific EP remote steering systems Market Value, By Country, 2019-2030, Million USD
FIGURE 58. Rest of World EP remote steering systems Market Value, By Country, 2019-2030, Million USD
FIGURE 59. Other EP Laboratory Devices Market Value, By Region, 2019-2030, Million USD
FIGURE 60. North America Other EP Laboratory Devices Market Value, By Country, 2019-2030, Million USD
FIGURE 61. Europe Other EP Laboratory Devices Market Value, By Country, 2019-2030, Million USD
FIGURE 62. Asia-Pacific Other EP Laboratory Devices Market Value, By Country, 2019-2030, Million USD
FIGURE 63. Rest of World Other EP Laboratory Devices Market Value, By Country, 2019-2030, Million USD
FIGURE 64. EP Laboratory Devices Market Value, By Region, 2019-2030, Million USD
FIGURE 65. North America EP Laboratory Devices Market Value, By Country, 2019-2030, Million USD
FIGURE 66. Europe EP Laboratory Devices Market Value, By Country, 2019-2030, Million USD
FIGURE 67. Asia-Pacific EP Laboratory Devices Market Value, By Country, 2019-2030, Million USD
FIGURE 68. Rest of World EP Laboratory Devices Market Value, By Country, 2019-2030, Million USD
FIGURE 69. Global EP Diagnostic Catheters Market Value, By Product, 2019-2030, Million USD
FIGURE 70. Conventional EP Diagnostic Catheters Market Value, By Region, 2019-2030, Million USD
FIGURE 71. North America Conventional EP Diagnostic Catheters Market Value, By Country, 2019-2030, Million USD
FIGURE 72. Europe Conventional EP Diagnostic Catheters Market Value, By Country, 2019-2030, Million USD
FIGURE 73. Asia-Pacific Conventional EP Diagnostic Catheters Market Value, By Country, 2019-2030, Million USD
FIGURE 74. Rest of World Conventional EP Diagnostic Catheters Market Value, By Country, 2019-2030, Million USD
FIGURE 75. Advanced EP Diagnostic Catheters Market Value, By Region, 2019-2030, Million USD
FIGURE 76. North America Advanced EP Diagnostic Catheters Market Value, By Country, 2019-2030, Million USD
FIGURE 77. Europe Advanced EP Diagnostic Catheters Market Value, By Country, 2019-2030, Million USD
FIGURE 78. Asia-Pacific Advanced EP Diagnostic Catheters Market Value, By Country, 2019-2030, Million USD
FIGURE 79. Rest of World Advanced EP Diagnostic Catheters Market Value, By Country, 2019-2030, Million USD
FIGURE 80. Ultrasound EP Diagnostic Catheters Market Value, By Region, 2019-2030, Million USD
FIGURE 81. North America Ultrasound EP Diagnostic Catheters Market Value, By Country, 2019-2030, Million USD
FIGURE 82. Europe Ultrasound EP Diagnostic Catheters Market Value, By Country, 2019-2030, Million USD
FIGURE 83. Asia-Pacific Ultrasound EP Diagnostic Catheters Market Value, By Country, 2019-2030, Million USD
FIGURE 84. Rest of World Ultrasound EP Diagnostic Catheters Market Value, By Country, 2019-2030, Million USD
FIGURE 85. EP Diagnostic Catheters Market Value, By Region, 2019-2030, Million USD
FIGURE 86. North America EP Diagnostic Catheters Market Value, By Country, 2019-2030, Million USD
FIGURE 87. Europe EP Diagnostic Catheters Market Value, By Country, 2019-2030, Million USD
FIGURE 88. Asia-Pacific EP Diagnostic Catheters Market Value, By Country, 2019-2030, Million USD
FIGURE 89. Rest of World EP Diagnostic Catheters Market Value, By Country, 2019-2030, Million USD
FIGURE 90. Access Devices Market Value, By Region, 2019-2030, Million USD
FIGURE 91. North America Access Devices Market Value, By Country, 2019-2030, Million USD
FIGURE 92. Europe Access Devices Market Value, By Country, 2019-2030, Million USD
FIGURE 93. Asia-Pacific Access Devices Market Value, By Country, 2019-2030, Million USD
FIGURE 94. Rest of World Access Devices Market Value, By Country, 2019-2030, Million USD
FIGURE 95. Global Electrophysiology Market Value, By Indication, 2019-2030, Million USD
FIGURE 96. Atrial Fibrillation Market Value, By Region, 2019-2030, Million USD
FIGURE 97. North America Atrial Fibrillation Market Value, By Country, 2019-2030, Million USD
FIGURE 98. Europe Atrial Fibrillation Market Value, By Country, 2019-2030, Million USD
FIGURE 99. Asia-Pacific Atrial Fibrillation Market Value, By Country, 2019-2030, Million USD
FIGURE 100. Rest of World Atrial Fibrillation Market Value, By Country, 2019-2030, Million USD
FIGURE 101. Atrial Flutter Market Value, By Region, 2019-2030, Million USD
FIGURE 102. North America Atrial Flutter Market Value, By Country, 2019-2030, Million USD
FIGURE 103. Europe Atrial Flutter Market Value, By Country, 2019-2030, Million USD
FIGURE 104. Asia-Pacific Atrial Flutter Market Value, By Country, 2019-2030, Million USD
FIGURE 105. Rest of World Atrial Flutter Market Value, By Country, 2019-2030, Million USD
FIGURE 106. Atrioventricular Nodal Reentry Tachycardia Market Value, By Region, 2019-2030, Million USD
FIGURE 107. North America Atrioventricular Nodal Reentry Tachycardia Market Value, By Country, 2019-2030, Million USD
FIGURE 108. Europe Atrioventricular Nodal Reentry Tachycardia Market Value, By Country, 2019-2030, Million USD
FIGURE 109. Asia-Pacific Atrioventricular Nodal Reentry Tachycardia Market Value, By Country, 2019-2030, Million USD
FIGURE 110. Rest of World Atrioventricular Nodal Reentry Tachycardia Market Value, By Country, 2019-2030, Million USD
FIGURE 111. Wolff-Parkinson-White Syndrome Market Value, By Region, 2019-2030, Million USD
FIGURE 112. North America Wolff-Parkinson-White Syndrome Market Value, By Country, 2019-2030, Million USD
FIGURE 113. Europe Wolff-Parkinson-White Syndrome Market Value, By Country, 2019-2030, Million USD
FIGURE 114. Asia-Pacific Wolff-Parkinson-White Syndrome Market Value, By Country, 2019-2030, Million USD
FIGURE 115. Rest of World Wolff-Parkinson-White Syndrome Market Value, By Country, 2019-2030, Million USD
FIGURE 116. Other Indication Market Value, By Region, 2019-2030, Million USD
FIGURE 117. North America Other Indication Market Value, By Country, 2019-2030, Million USD
FIGURE 118. Europe Other Indication Market Value, By Country, 2019-2030, Million USD
FIGURE 119. Asia-Pacific Other Indication Market Value, By Country, 2019-2030, Million USD
FIGURE 120. Rest of World Other Indication Market Value, By Country, 2019-2030, Million USD
FIGURE 121. Global Electrophysiology Market Value, By Region, 2019-2030, Million USD
FIGURE 122. North America Electrophysiology Market Value, By Product, 2019-2030, Million USD
FIGURE 123. North America EP Ablation Catheters Market Value, By Product, 2019-2030, Million USD
FIGURE 124. North America EP Laboratory Devices Market Value, By Product, 2019-2030, Million USD
FIGURE 125. North America EP Diagnostic Catheters Market Value, By Product, 2019-2030, Million USD
FIGURE 126. North America Electrophysiology Market Value, By Indication, 2019-2030, Million USD
FIGURE 127. U.S Electrophysiology Market Value, By Product, 2019-2030, Million USD
FIGURE 128. U.S EP Ablation Catheters Market Value, By Product, 2019-2030, Million USD
FIGURE 129. U.S EP Laboratory Devices Market Value, By Product, 2019-2030, Million USD
FIGURE 130. U.S EP Diagnostic Catheters Market Value, By Product, 2019-2030, Million USD
FIGURE 131. U.S Electrophysiology Market Value, By Indication, 2019-2030, Million USD
FIGURE 132. Canada Electrophysiology Market Value, By Product, 2019-2030, Million USD
FIGURE 133. Canada EP Ablation Catheters Market Value, By Product, 2019-2030, Million USD
FIGURE 134. Canada EP Laboratory Devices Market Value, By Product, 2019-2030, Million USD
FIGURE 135. Canada EP Diagnostic Catheters Market Value, By Product, 2019-2030, Million USD
FIGURE 136. Canada Electrophysiology Market Value, By Indication, 2019-2030, Million USD
FIGURE 137. Mexico Electrophysiology Market Value, By Product, 2019-2030, Million USD
FIGURE 138. Mexico EP Ablation Catheters Market Value, By Product, 2019-2030, Million USD
FIGURE 139. Mexico EP Laboratory Devices Market Value, By Product, 2019-2030, Million USD
FIGURE 140. Mexico EP Diagnostic Catheters Market Value, By Product, 2019-2030, Million USD
FIGURE 141. Mexico Electrophysiology Market Value, By Indication, 2019-2030, Million USD
FIGURE 142. Europe Electrophysiology Market Value, By Product, 2019-2030, Million USD
FIGURE 143. Europe EP Ablation Catheters Market Value, By Product, 2019-2030, Million USD
FIGURE 144. Europe EP Laboratory Devices Market Value, By Product, 2019-2030, Million USD
FIGURE 145. Europe EP Diagnostic Catheters Market Value, By Product, 2019-2030, Million USD
FIGURE 146. Europe Electrophysiology Market Value, By Indication, 2019-2030, Million USD
FIGURE 147. Germany Electrophysiology Market Value, By Product, 2019-2030, Million USD
FIGURE 148. Germany EP Ablation Catheters Market Value, By Product, 2019-2030, Million USD
FIGURE 149. Germany EP Laboratory Devices Market Value, By Product, 2019-2030, Million USD
FIGURE 150. Germany EP Diagnostic Catheters Market Value, By Product, 2019-2030, Million USD
FIGURE 151. Germany Electrophysiology Market Value, By Indication, 2019-2030, Million USD
FIGURE 152. Italy Electrophysiology Market Value, By Product, 2019-2030, Million USD
FIGURE 153. Italy EP Ablation Catheters Market Value, By Product, 2019-2030, Million USD
FIGURE 154. Italy EP Laboratory Devices Market Value, By Product, 2019-2030, Million USD
FIGURE 155. Italy EP Diagnostic Catheters Market Value, By Product, 2019-2030, Million USD
FIGURE 156. Italy Electrophysiology Market Value, By Indication, 2019-2030, Million USD
FIGURE 157. UK Electrophysiology Market Value, By Product, 2019-2030, Million USD
FIGURE 158. UK EP Ablation Catheters Market Value, By Product, 2019-2030, Million USD
FIGURE 159. UK EP Laboratory Devices Market Value, By Product, 2019-2030, Million USD
FIGURE 160. UK EP Diagnostic Catheters Market Value, By Product, 2019-2030, Million USD
FIGURE 161. UK Electrophysiology Market Value, By Indication, 2019-2030, Million USD
FIGURE 162. France Electrophysiology Market Value, By Product, 2019-2030, Million USD
FIGURE 163. France EP Ablation Catheters Market Value, By Product, 2019-2030, Million USD
FIGURE 164. France EP Laboratory Devices Market Value, By Product, 2019-2030, Million USD
FIGURE 165. France EP Diagnostic Catheters Market Value, By Product, 2019-2030, Million USD
FIGURE 166. France Electrophysiology Market Value, By Indication, 2019-2030, Million USD
FIGURE 167. Rest of Europe Electrophysiology Market Value, By Product, 2019-2030, Million USD
FIGURE 168. Rest of Europe EP Ablation Catheters Market Value, By Product, 2019-2030, Million USD
FIGURE 169. Rest of Europe EP Laboratory Devices Market Value, By Product, 2019-2030, Million USD
FIGURE 170. Rest of Europe EP Diagnostic Catheters Market Value, By Product, 2019-2030, Million USD
FIGURE 171. Rest of Europe Electrophysiology Market Value, By Indication, 2019-2030, Million USD
FIGURE 172. Asia-Pacific Electrophysiology Market Value, By Product, 2019-2030, Million USD
FIGURE 173. Asia-Pacific EP Ablation Catheters Market Value, By Product, 2019-2030, Million USD
FIGURE 174. Asia-Pacific EP Laboratory Devices Market Value, By Product, 2019-2030, Million USD
FIGURE 175. Asia-Pacific EP Diagnostic Catheters Market Value, By Product, 2019-2030, Million USD
FIGURE 176. Asia-Pacific Electrophysiology Market Value, By Indication, 2019-2030, Million USD
FIGURE 177. Japan Electrophysiology Market Value, By Product, 2019-2030, Million USD
FIGURE 178. Japan EP Ablation Catheters Market Value, By Product, 2019-2030, Million USD
FIGURE 179. Japan EP Laboratory Devices Market Value, By Product, 2019-2030, Million USD
FIGURE 180. Japan EP Diagnostic Catheters Market Value, By Product, 2019-2030, Million USD
FIGURE 181. Japan Electrophysiology Market Value, By Indication, 2019-2030, Million USD
FIGURE 182. China Electrophysiology Market Value, By Product, 2019-2030, Million USD
FIGURE 183. China EP Ablation Catheters Market Value, By Product, 2019-2030, Million USD
FIGURE 184. China EP Laboratory Devices Market Value, By Product, 2019-2030, Million USD
FIGURE 185. China EP Diagnostic Catheters Market Value, By Product, 2019-2030, Million USD
FIGURE 186. China Electrophysiology Market Value, By Indication, 2019-2030, Million USD
FIGURE 187. Australia Electrophysiology Market Value, By Product, 2019-2030, Million USD
FIGURE 188. Australia EP Ablation Catheters Market Value, By Product, 2019-2030, Million USD
FIGURE 189. Australia EP Laboratory Devices Market Value, By Product, 2019-2030, Million USD
FIGURE 190. Australia EP Diagnostic Catheters Market Value, By Product, 2019-2030, Million USD
FIGURE 191. Australia Electrophysiology Market Value, By Indication, 2019-2030, Million USD
FIGURE 192. India Electrophysiology Market Value, By Product, 2019-2030, Million USD
FIGURE 193. India EP Ablation Catheters Market Value, By Product, 2019-2030, Million USD
FIGURE 194. India EP Laboratory Devices Market Value, By Product, 2019-2030, Million USD
FIGURE 195. India EP Diagnostic Catheters Market Value, By Product, 2019-2030, Million USD
FIGURE 196. India Electrophysiology Market Value, By Indication, 2019-2030, Million USD
FIGURE 197. Rest of Asia-Pacific Electrophysiology Market Value, By Product, 2019-2030, Million USD
FIGURE 198. Rest of Asia-Pacific EP Ablation Catheters Market Value, By Product, 2019-2030, Million USD
FIGURE 199. Rest of Asia-Pacific EP Laboratory Devices Market Value, By Product, 2019-2030, Million USD
FIGURE 200. Rest of Asia-Pacific EP Diagnostic Catheters Market Value, By Product, 2019-2030, Million USD
FIGURE 201. Rest of Asia-Pacific Electrophysiology Market Value, By Indication, 2019-2030, Million USD
FIGURE 202. Rest of World Electrophysiology Market Value, By Product, 2019-2030, Million USD
FIGURE 203. Rest of World EP Ablation Catheters Market Value, By Product, 2019-2030, Million USD
FIGURE 204. Rest of World EP Laboratory Devices Market Value, By Product, 2019-2030, Million USD
FIGURE 205. Rest of World EP Diagnostic Catheters Market Value, By Product, 2019-2030, Million USD
FIGURE 206. Rest of World Electrophysiology Market Value, By Indication, 2019-2030, Million USD
FIGURE 207. Brazil Electrophysiology Market Value, By Product, 2019-2030, Million USD
FIGURE 208. Brazil EP Ablation Catheters Market Value, By Product, 2019-2030, Million USD
FIGURE 209. Brazil EP Laboratory Devices Market Value, By Product, 2019-2030, Million USD
FIGURE 210. Brazil EP Diagnostic Catheters Market Value, By Product, 2019-2030, Million USD
FIGURE 211. Brazil Electrophysiology Market Value, By Indication, 2019-2030, Million USD
FIGURE 212. Argentina Electrophysiology Market Value, By Product, 2019-2030, Million USD
FIGURE 213. Argentina EP Ablation Catheters Market Value, By Product, 2019-2030, Million USD
FIGURE 214. Argentina EP Laboratory Devices Market Value, By Product, 2019-2030, Million USD
FIGURE 215. Argentina EP Diagnostic Catheters Market Value, By Product, 2019-2030, Million USD
FIGURE 216. Argentina Electrophysiology Market Value, By Indication, 2019-2030, Million USD
FIGURE 217. Egypt Electrophysiology Market Value, By Product, 2019-2030, Million USD
FIGURE 218. Egypt EP Ablation Catheters Market Value, By Product, 2019-2030, Million USD
FIGURE 219. Egypt EP Laboratory Devices Market Value, By Product, 2019-2030, Million USD
FIGURE 220. Egypt EP Diagnostic Catheters Market Value, By Product, 2019-2030, Million USD
FIGURE 221. Egypt Electrophysiology Market Value, By Indication, 2019-2030, Million USD
FIGURE 222. Israel Electrophysiology Market Value, By Product, 2019-2030, Million USD
FIGURE 223. Israel EP Ablation Catheters Market Value, By Product, 2019-2030, Million USD
FIGURE 224. Israel EP Laboratory Devices Market Value, By Product, 2019-2030, Million USD
FIGURE 225. Israel EP Diagnostic Catheters Market Value, By Product, 2019-2030, Million USD
FIGURE 226. Israel Electrophysiology Market Value, By Indication, 2019-2030, Million USD
FIGURE 227. South Africa Electrophysiology Market Value, By Product, 2019-2030, Million USD
FIGURE 228. South Africa EP Ablation Catheters Market Value, By Product, 2019-2030, Million USD
FIGURE 229. South Africa EP Laboratory Devices Market Value, By Product, 2019-2030, Million USD
FIGURE 230. South Africa EP Diagnostic Catheters Market Value, By Product, 2019-2030, Million USD
FIGURE 231. South Africa Electrophysiology Market Value, By Indication, 2019-2030, Million USD
FIGURE 232. Abbott Laboratories: NET SALES,2017-2019
FIGURE 233. Johnson & Johnson: NET SALES,2017-2019
FIGURE 234. Microport Scientific Corporation: NET SALES,2017-2019
FIGURE 235. Boston Scientific Corporation: NET SALES,2017-2019
FIGURE 236. St. Jude Medical, Inc.: NET SALES,2017-2019
FIGURE 237. Medtronic plc: NET SALES,2017-2019
FIGURE 238. Biotronik SE & Co. KG: NET SALES,2017-2019
FIGURE 239. Koninklijke Philips N.V.: NET SALES,2017-2019
FIGURE 240. General Electric Co.: NET SALES,2017-2019
FIGURE 241. Siemens AG: NET SALES,2017-2019
At Next Move Strategy Consulting, we understand that insightful market research is the cornerstone of successful business decisions. That's why we employ a robust and multifaceted approach, combining various methodologies to deliver the most accurate and actionable data for our clients.
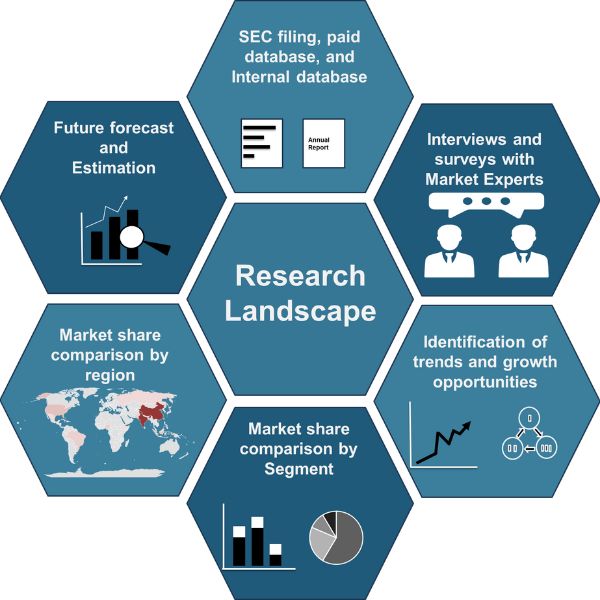
Research Landscape
We navigate the world of research with two primary approaches:
Our qualitative research methodologies involve immersive techniques such as in-depth interviews, focus groups, and observational studies. By engaging directly with individuals and stakeholders, we uncover valuable insights that quantitative data alone may overlook.
Quantitative Research
In tandem with qualitative methodologies, NMSC leverages the power of Quantitative Research to provide a robust foundation of numerical insights. Through systematic data collection and analysis, we quantify patterns, preferences, and market trends, offering a comprehensive view of the business landscape.
Our quantitative research approach employs diverse tools, including surveys, experiments, and statistical modelling. These methodologies enable us to gather data from a large and representative sample, ensuring the statistical significance of our findings. By employing structured questionnaires and standardized data collection methods, we guarantee the reliability and validity of the information we present to our clients.
Quantitative research is particularly effective in measuring the prevalence of trends, assessing market size, and gauging the impact of various factors on consumer behavior. The numerical precision attained through this approach equips our clients with actionable insights, facilitating data-driven decision-making and strategy formulation.
We deploy a specialized arsenal of techniques tailored to meet your unique requirements. Here's a glimpse into our comprehensive toolbox:
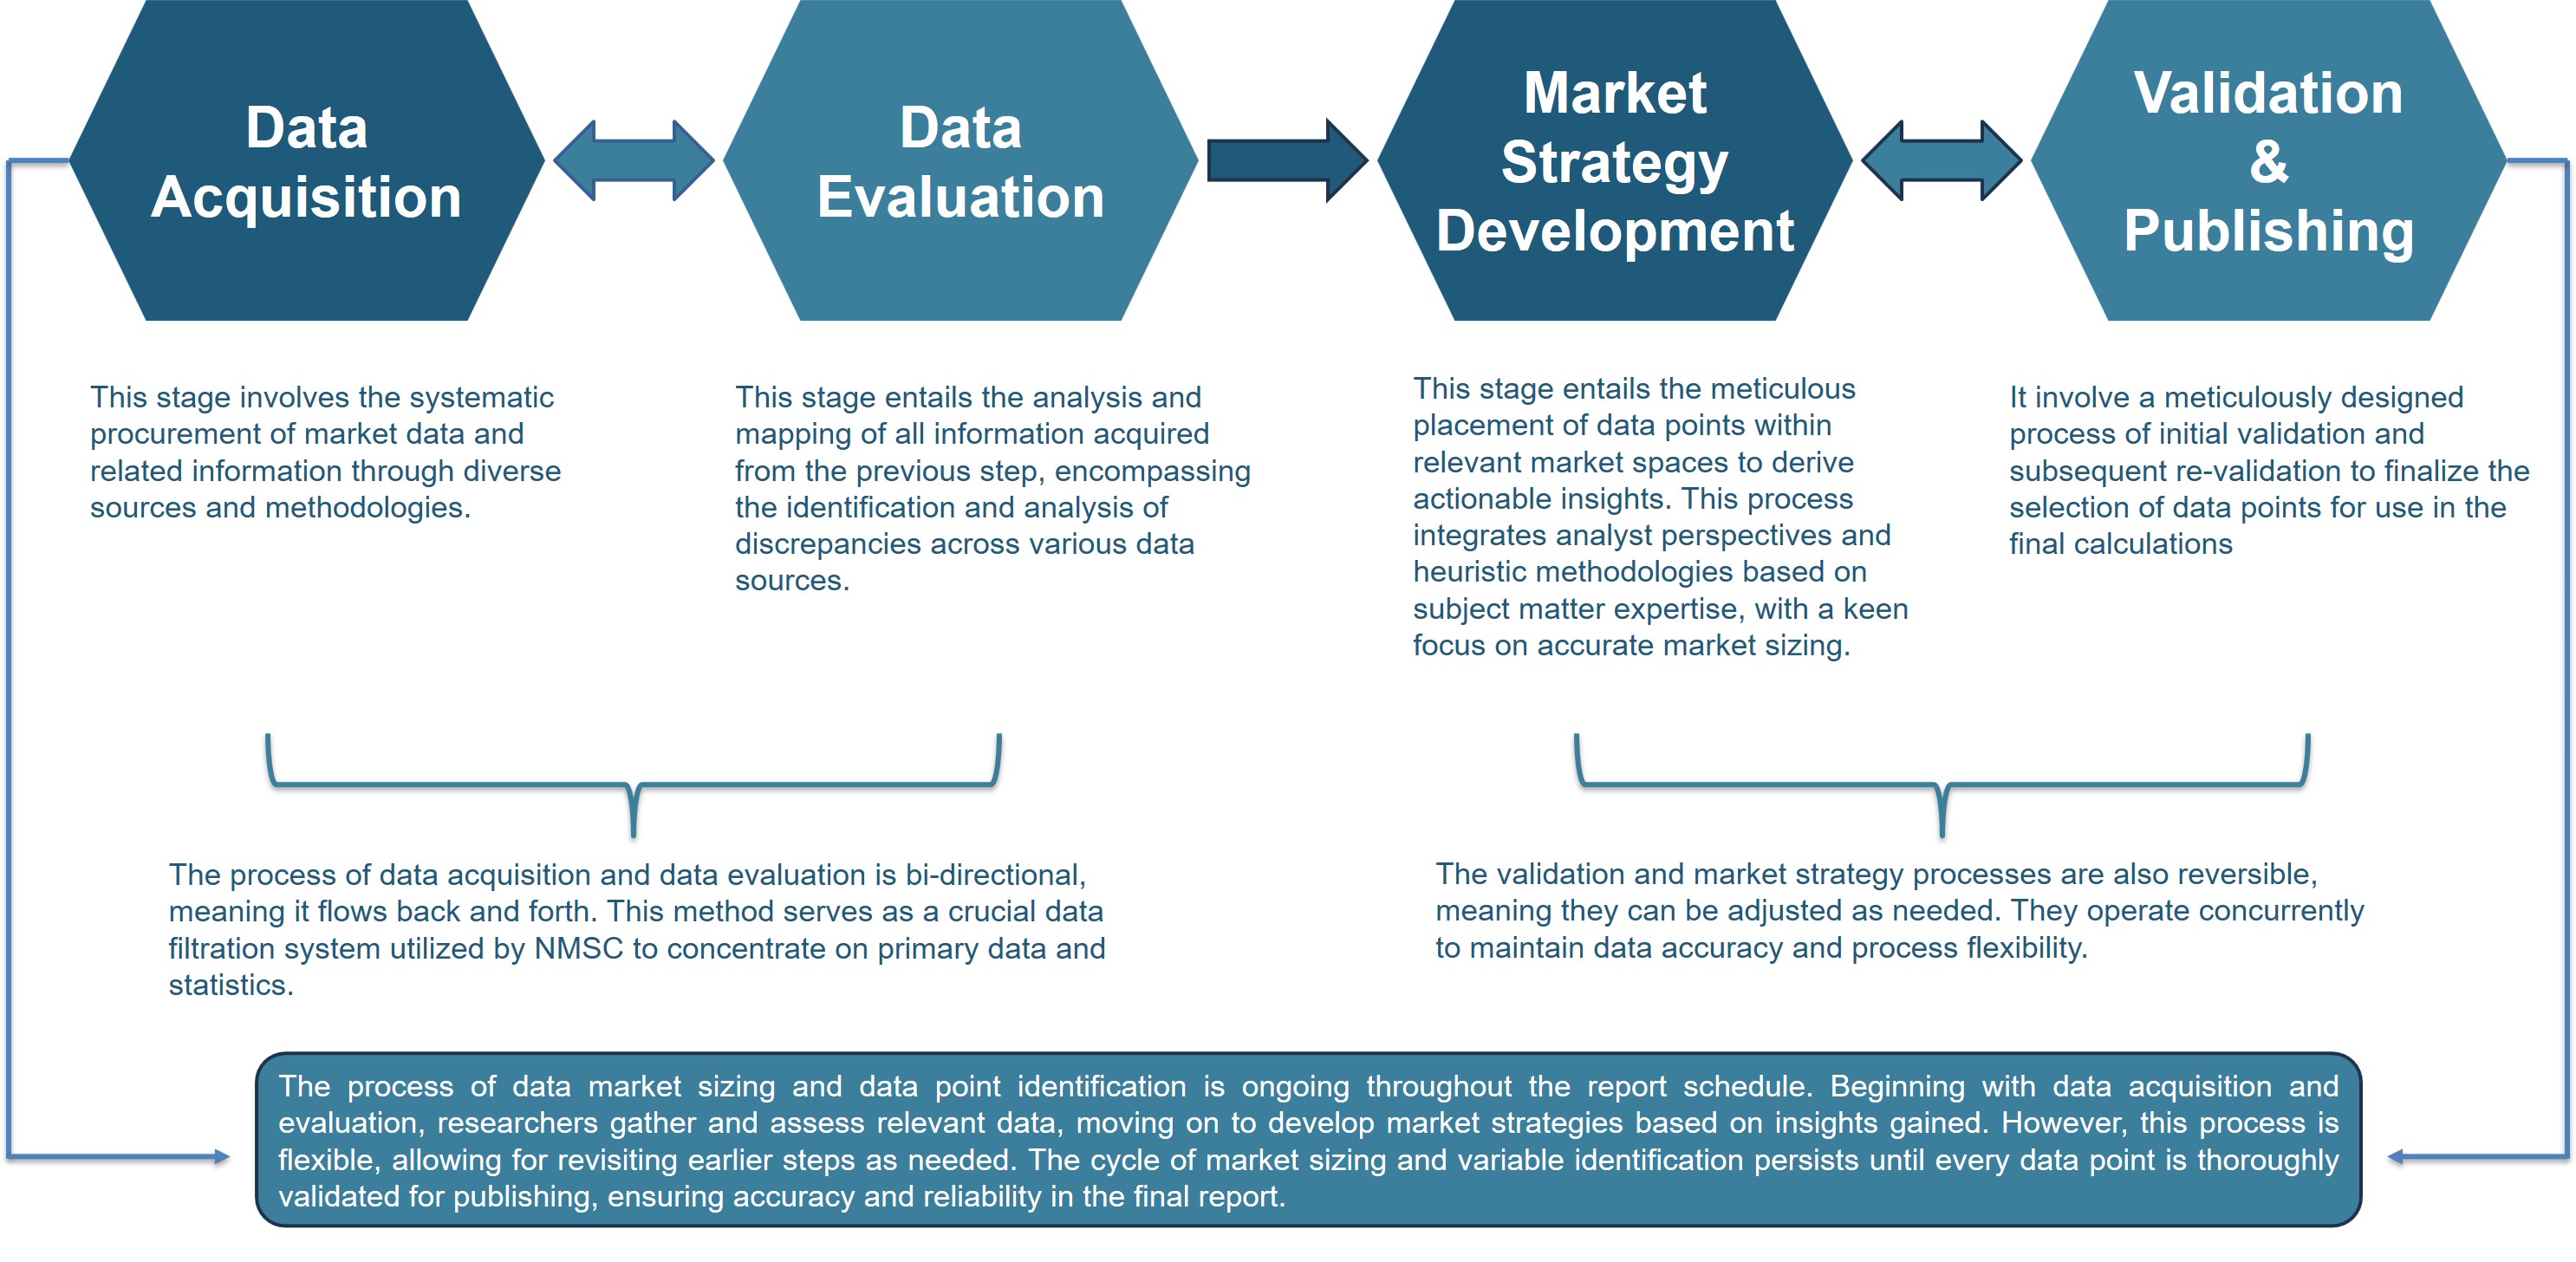
The stage entails acquiring market data or relevant information through various sources and methodologies.
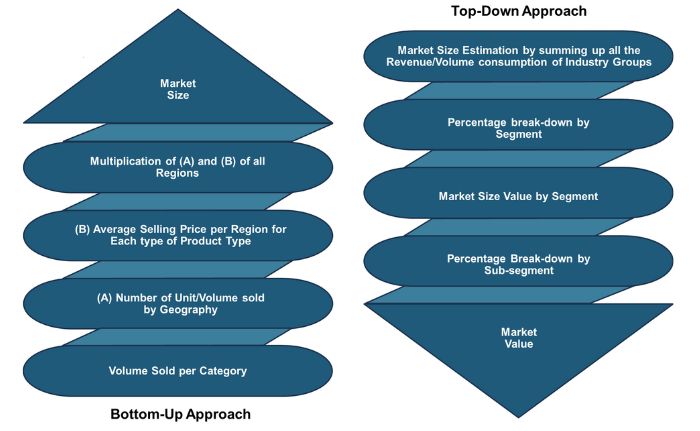
We utilize both top-down and bottom-up approaches in market research analysis to achieve a comprehensive understanding of the market dynamics, leveraging the broad perspective of industry trends and macroeconomic factors alongside detailed insights from specific segments and individual companies.
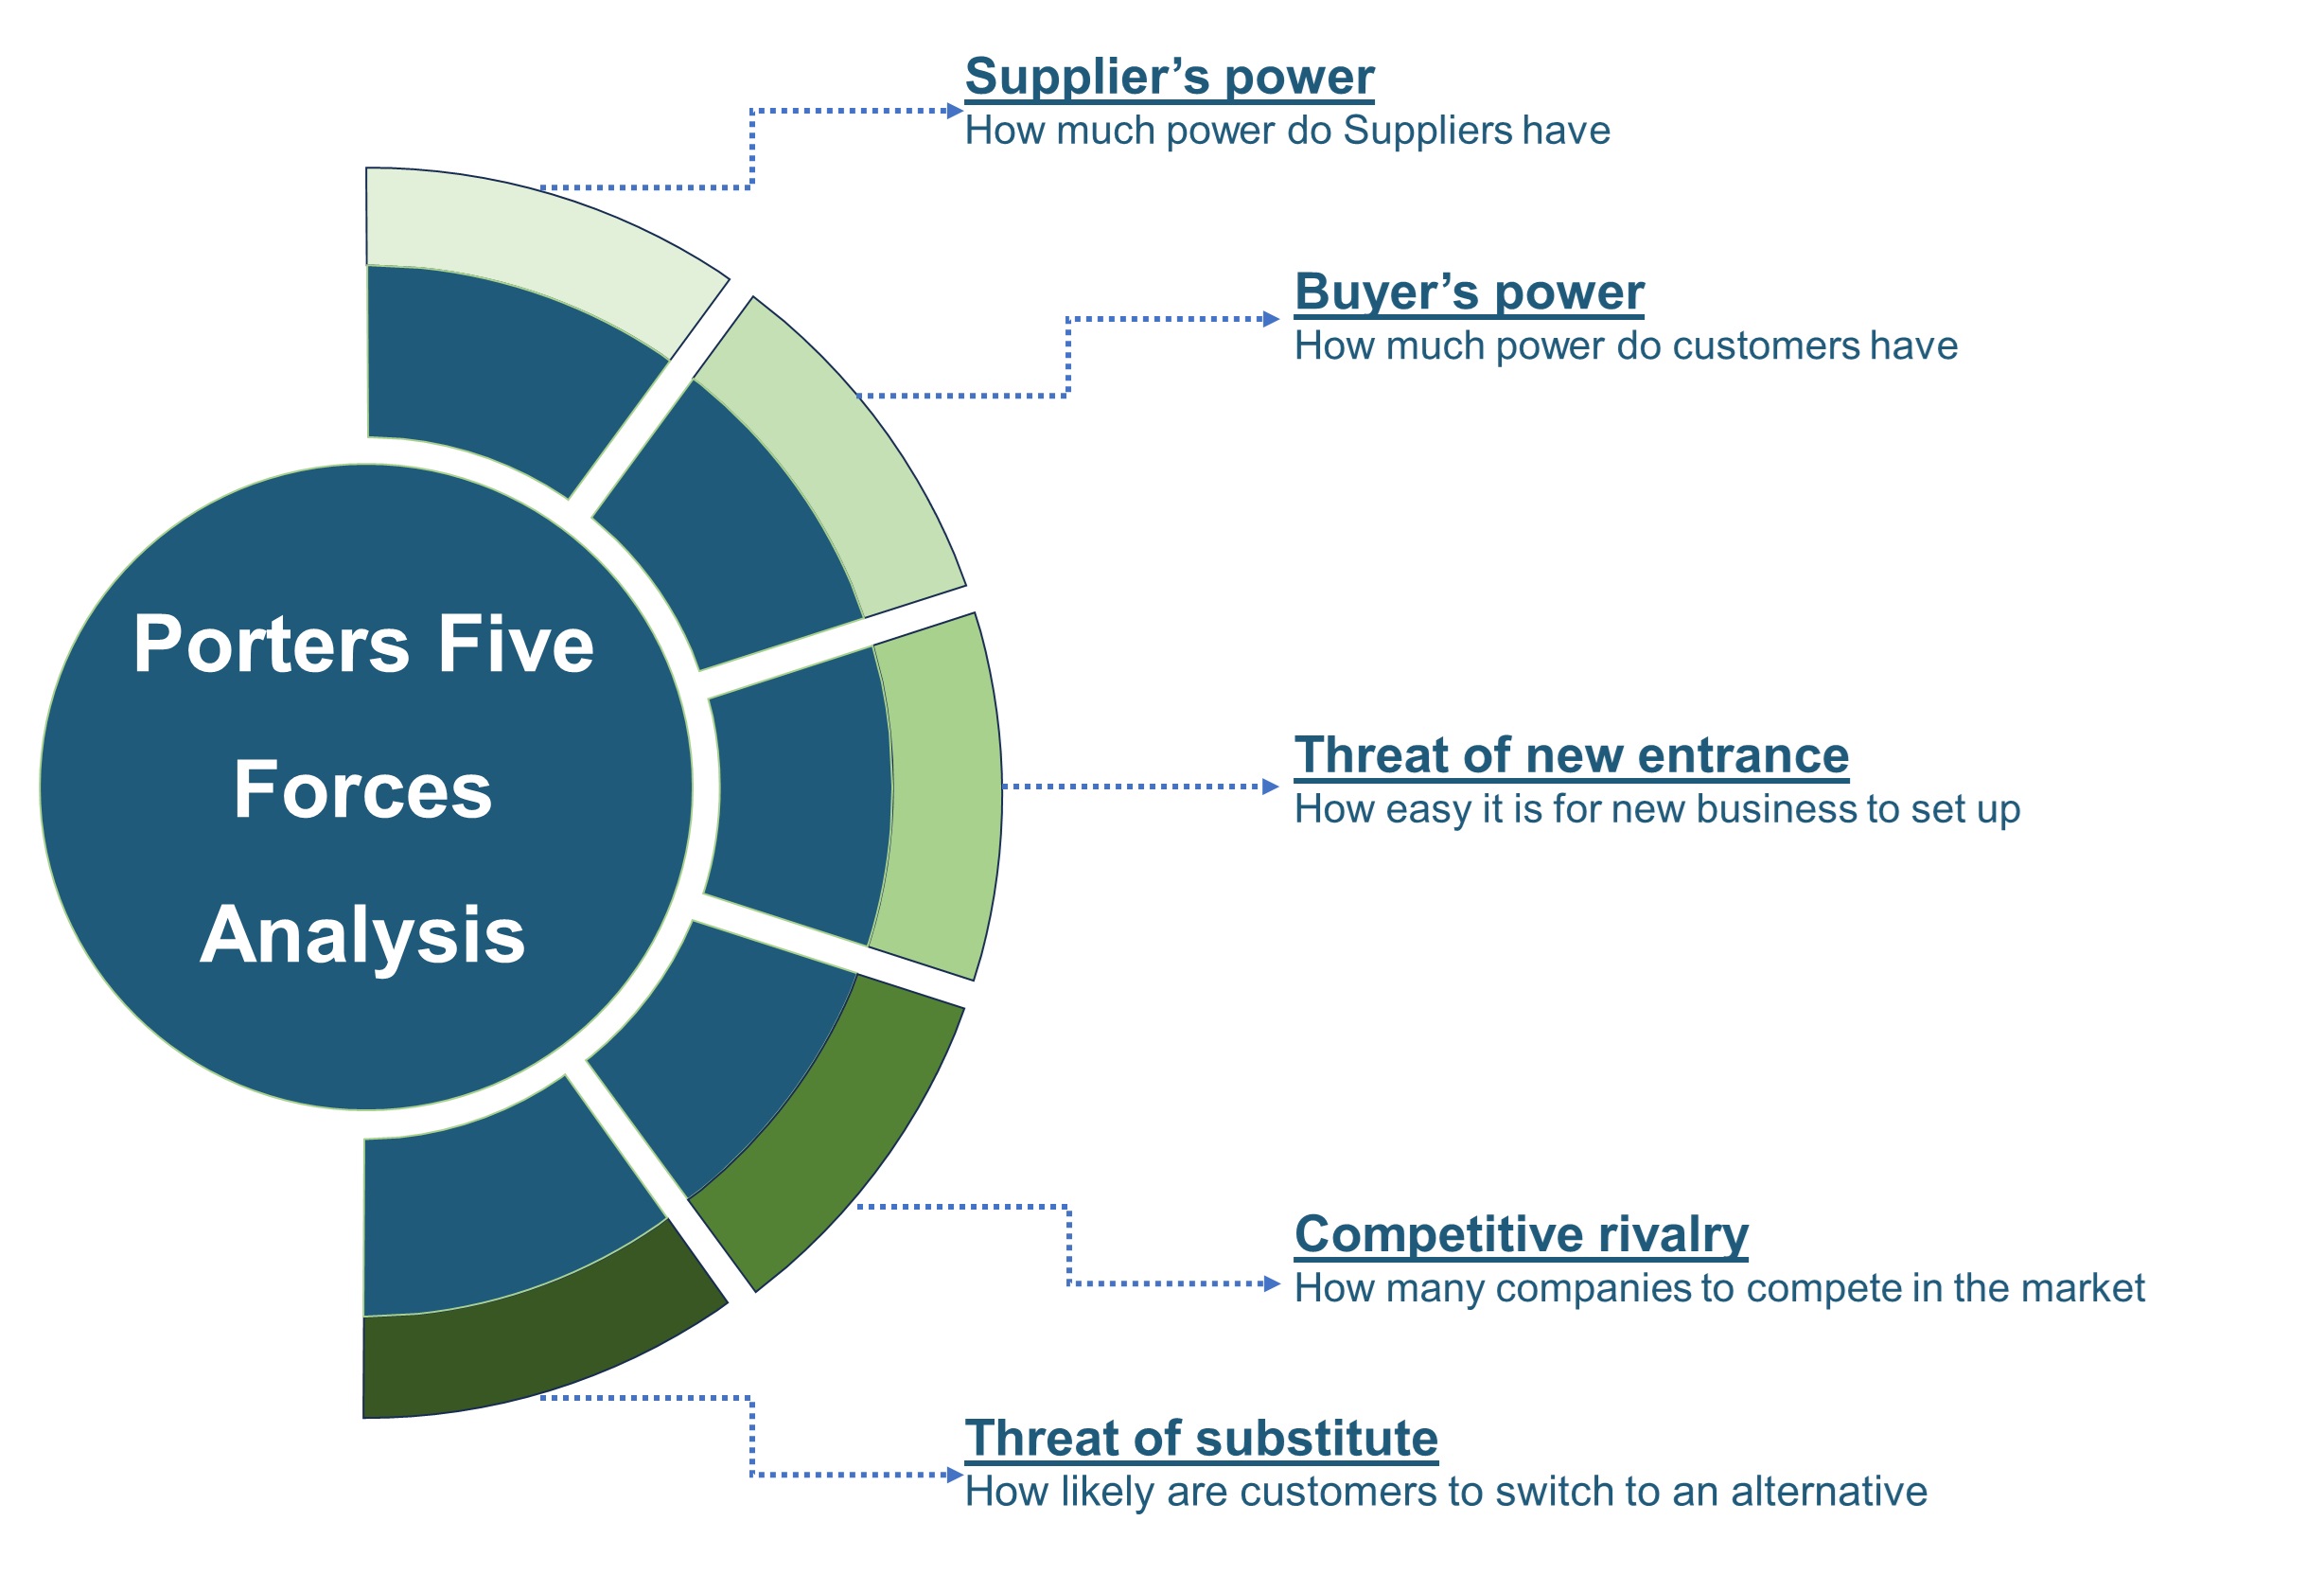
We conduct Porter's Five Forces analysis to evaluate the competitive landscape of an industry, providing us with insights into factors that affect profitability and strategic positioning.
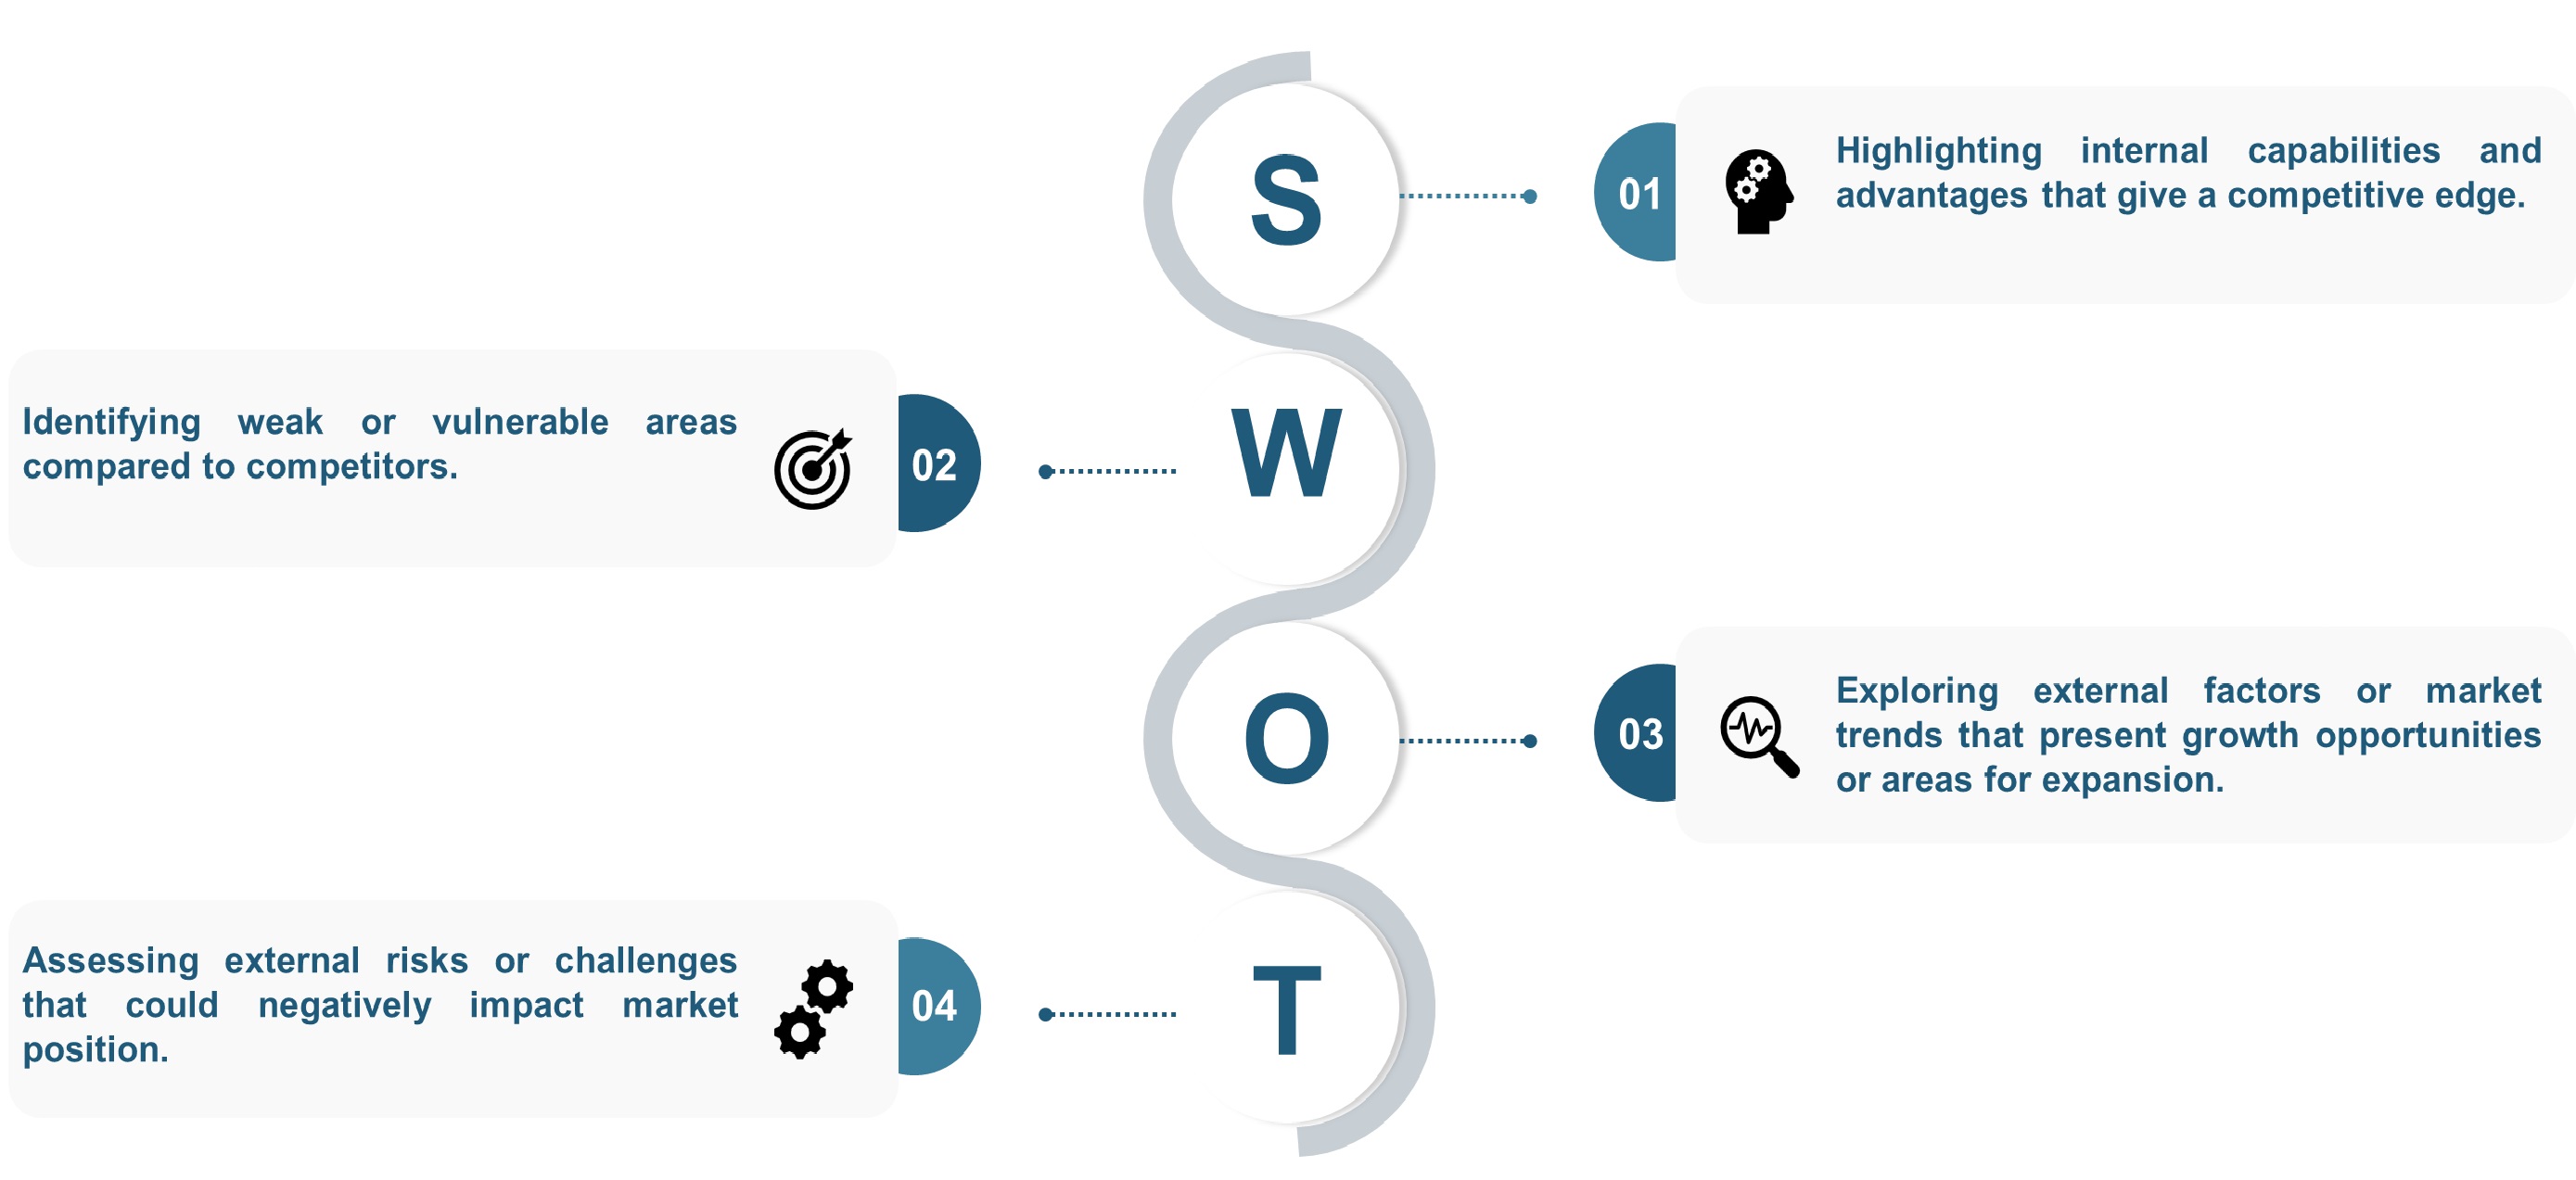
We conduct SWOT analysis to understand market trends, identify potential threats, capitalize on opportunities, and assess our strengths and weaknesses.
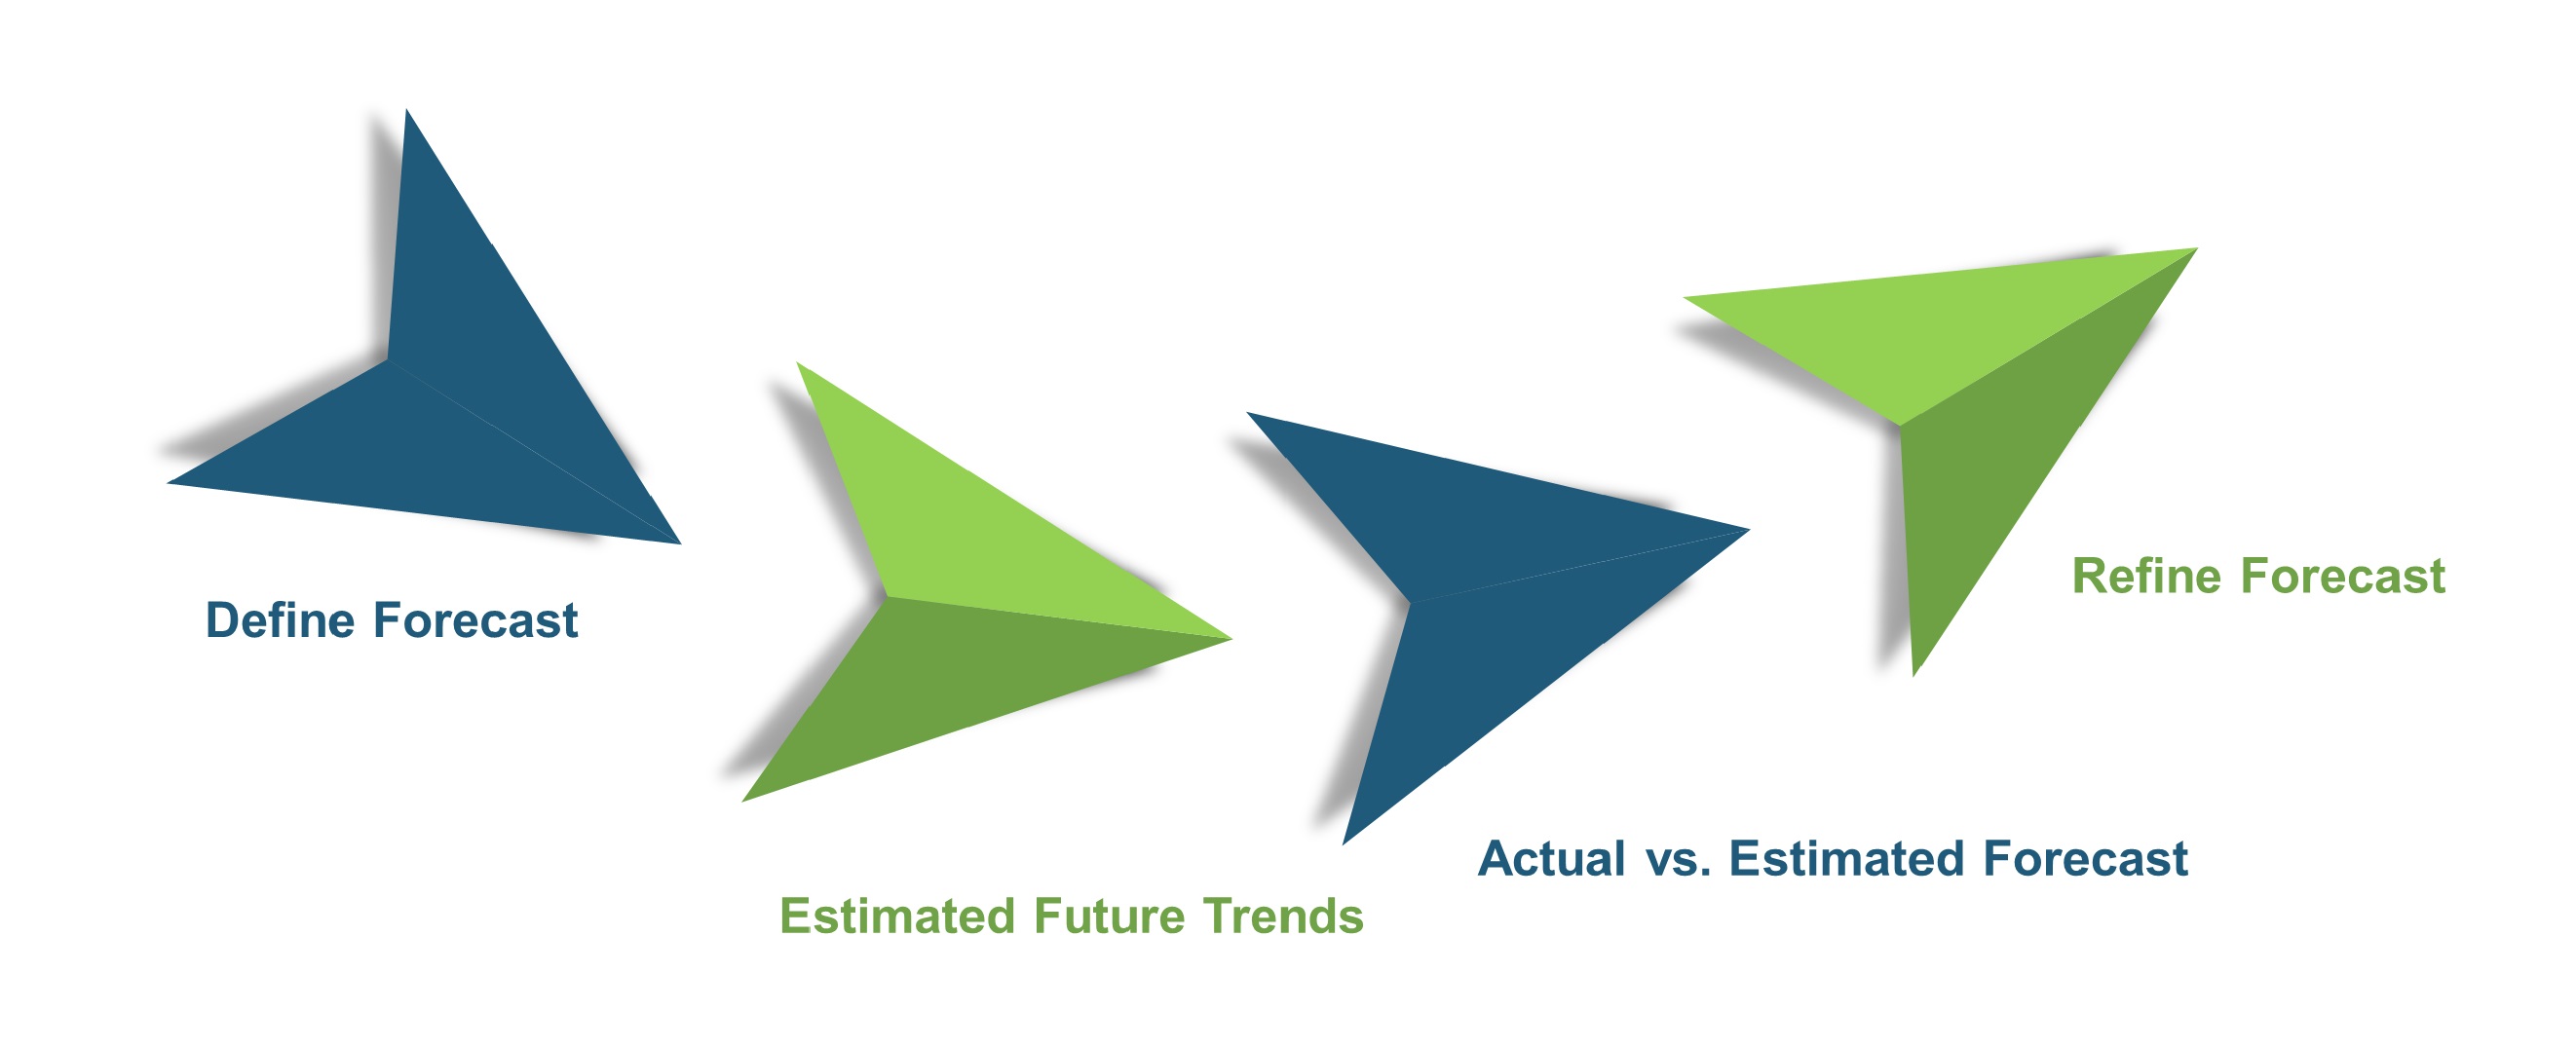
We utilize a forecasting model to predict future consumption by considering parameters like population, economics, regulations, market competition, drivers, constraints, technology, and pricing. We also employ statistical techniques such as multilinear regression, exponential smoothing, moving average, ARIMA, and Monte Carlo simulations for accurate predictions. In econometric forecasting, we analyzed short-term and long-term event impacts, attributing values based on regulatory frameworks, economic factors, and market events.
Introduction The landscape of medical interventions is un...
Introduction Dialysis, a crucial medical procedure, is ca...
Introduction Patient monitoring refers to the continuous or periodic observat...
Please provide your company email address for a faster response
Features |
|
|
|
|
|||||
---|---|---|---|---|---|---|---|---|---|
Single User
|
Multi User
|
Enterprise User
|
Data Pack
|
||||||
US $ 3,975
|
US $ 4,975
|
US $ 6,975
|
US $ 2,975
|
||||||
1 user only
|
1 user only
|
Unlimited access within the Organization
|
1 user only
|
||||||
Free Customization |
20 hours |
40 hours |
>60 hours |
NA |
|||||
Duration Of Free Analyst Support |
3 months post purchase |
6 months post purchase |
12 months post purchase |
NA |
|||||
Direct Access to the Analyst Team Through Calls / Email |
|
|
|
|
|||||
Deliverable Format |
|
|
|||||||
|
|||||||||
Discount on Your Next Purchase |
No Discount |
15% |
No Discount |
No Discount |
|||||
Permission to Print the Report |
This website uses cookies to ensure you get the best experience on our website. Learn more
✖