Graph Technologies Market by Type (Property Graph Databases, Semantic Graph Databases, and Spatial Graph Databases), by Deployment Mode (On-Premises Deployment, Cloud-Based Deployment, and Hybrid Deployment), by Organization Size (Small & Medium-sized Enterprises and Large Enterprises) and Others – Global Opportunity Analysis and Industry Forecast 2024-2030


US Tariff Impact on Graph Technologies Market
Trump Tariffs Are Reshaping Global Business
Graph Technologies Market Overview
The global Graph Technologies Market size was valued at USD 3.44 billion in 2023 and is predicted to reach USD 13.26 billion by 2030 with a CAGR of 21.3% from 2024-2030. The graph technologies market encompasses a range of tools and solutions designed to manage, analyze, and visualize complex relationships and data structures. This technology is essential for managing, analyzing, and visualizing complex relationships within data.
These technologies, including graph databases and analytics platforms, enable businesses to uncover patterns and connections that traditional databases struggle to identify. Industries such as finance, telecommunications, healthcare, and social media utilize graph technologies for applications such as fraud detection, recommendation engines, and network analysis.
As companies increasingly focus on data-driven strategies, the demand for graph technologies is growing, driven by advancements in AI and machine learning. These technologies allow businesses to handle intricate datasets, enhance decision-making, and drive innovation, making them vital tools for staying competitive in a data-rich environment.
Market Dynamics and Trends
The growing adoption of graph technologies in healthcare and life sciences industries for efficient data integration and analysis to manage patient records, identify disease patterns, and enhance drug discovery is driving the growth of the graph technologies market. For instance, in March 2024, BioXcelerate AI, a subsidiary of Optima Partners Limited, launched an AI tool for faster drug discovery, leveraging graph technologies.
By using graph databases and algorithms, the tool accurately identifies potential drug candidates, significantly reducing the time and cost associated with developing new medications while contributing towards the development of healthcare industry.
Moreover, with the expansion of IoT and connected devices which generate vast amount of data that require analysis and interpretation to improve insights and decision-making is further boosting the growth of the market. Graph technologies are well-suited for handling complex, interconnected data, enabling better insights and decision-making.
For instance, the number of connected devices such as smart home appliances, cars, and other wearables reached 15 billion globally in 2024. As more devices connect and communicate, the need for advanced data management and analysis tools becomes crucial, further boosting the demand for graph technologies to optimize processes and uncover valuable patterns within the data. However, complexity along with high cost of implementation and maintenance compared to traditional analysis solutions restrains the graph technologies market growth.
On the contrary, the introduction of graph neural networks (GNNs) enhances the ability to analyze and interpret complex, interconnected data by leveraging advanced machine learning techniques, particularly for applications such as social network analysis, recommendation systems, and biological data interpretation. This is anticipated to create numerous growth opportunities by improving the efficiency and accuracy of data insights and decision-making processes within various industries.
Market Segmentations and Scope of the Study
The graph technologies market report is segmented on the basis of type, deployment mode, organization size, end-user, and region. On the basis of type, the market is divided into property graph databases, semantic graph databases, and spatial graph databases. On the basis of deployment mode, the market is classified into on-premises deployment, cloud-based deployment, and hybrid deployment. On the basis of organization size, the market is segmented into small & medium-sized enterprises and large enterprises. On the basis of end-user, the market is segmented into BFSI, retail and ecommerce, telecom and it, healthcare, pharmaceuticals, and life sciences, government and public sector, manufacturing and automotive, media and entertainment, energy and utilities, travel and hospitality, transportation and logistics, and others. Regional breakdown and analysis of each of the aforesaid segments include regions comprising of North America, Europe, Asia-Pacific, and RoW.
Geographical Analysis
North America dominates the graph technologies market share and is expected to continue its dominance during the forecast period. This is due to the presence of one of the largest media & entertainment industries this region which generates vast amounts of data related to content, user preferences, and consumption patterns.
As stated by the Motion Picture Association of Canada, the entertainment industry production volume reached about USD 8.5 billion in 2022, with the country contributing around USD 10 billion to the country's GDP, an increase of 21% from 2021.
The presence of such massive industry drives the demand for analytical tools including graph technologies in this region to improve overall user experiences, driving the graph technologies market expansion.
Moreover, the presence of major key market players such as Amazon web services and IBM Corporation that are adopting various strategies including product launch and collaborations is further boosting the growth of the market in the region.
For instance, in October 2022, Amazon Web Services (AWS) introduced Amazon Neptune Serverless, an expansion to its graph database service. The new graph technology provides customers the flexibility to run graph workloads on-demand and auto-scale capacity as needed, enhancing the accessibility and affordability of graph databases for application development.
On the other hand, Asia Pacific is expected to show a steady growth in the market. The presence of one of the largest BFSI sector in the Asia Pacific region is driving the growth of the graph technologies industry.
As reported by the China Banking and Insurance Regulatory Commission, China's BFSI sector size reached USD 51.19 trillion in 2022. The presence of such huge banking industry with millions of transactions taking place every day, the need for graph-based solutions to address data complexity and to enhance fraud detection & risk management is on the rise, driving the market growth.
Moreover, the growing eCommerce sector in the Asia Pacific region further boosts the growth of the graph technologies industry as it enables e-commerce businesses to analyze vast amounts of data to detect & prevent fraud, optimize supply chains, and gain valuable insights for marketing & sales strategies.
According to the International Trade Administration, China is the largest e-commerce market globally with its ecommerce industry reaching USD 3.56 trillion in 2024. This surge in eCommerce activity underscores the increasing demand for graph technologies to manage and leverage large-scale data effectively in this region.
Competitive Landscape
Various key market players operating in the graph technologies industry include Neo4j Inc., Amazon Neptune (a service by Amazon Web Services, Inc.), ArangoDB GmbH, DataStax, Inc., OrientDB Ltd., Stardog Union, Inc., Microsoft Corporation, Dgraph Labs, Inc., TigerGraph, Inc., and Kobai, Inc., and others. These market players are adopting various strategies such as product launches and partnership to remain dominant in the market.
For instance, in March 2023, Kobai announced the launch of Saturn Knowledge Graph, a powerful solution that enables organizations to query data at lakehouse scale. The Saturn Knowledge Graph leverages graph technology to provide a unified and flexible approach to data analysis, allowing businesses to gain valuable insights and make informed decisions based on complex and interconnected datasets stored in data lakes.
Moreover, in February 2023, Neo4j partnered with Temasek Polytechnic to launch Graphs4SG, an initiative aimed at training graph technology talent across Singapore. This collaboration aims to equip students and professionals with the necessary skills to harness the power of graph technologies and leverage them in various industries for data analysis and insights.
Furthermore, in May 2022, TigerGraph unveiled a new tool for machine learning modeling, further expanding its capabilities in the field of advanced analytics. The new tool aims to simplify and accelerate the process of developing and deploying machine learning models on graph data, enabling organizations to extract valuable insights and drive intelligent decision-making.
Key Benefits
-
The report provides quantitative analysis and estimations of the graph technologies market from 2024 to 2030, which assists in identifying the prevailing industry opportunities.
-
The study comprises a deep-dive analysis of the current and future graph technologies market to depict prevalent investment pockets in the industry.
-
Information related to key drivers, restraints, and opportunities and their impact on the market is provided in the report.
-
Competitive analysis of the key players, along with their market share is provided in the report.
-
Value chain analysis in the market study provides a clear picture of roles of stakeholders.
Graph Technologies Market Key Segments
By Type
-
Property Graph Databases
-
Semantic Graph Databases
-
Spatial Graph Databases
By Deployment Mode
-
On-Premises Deployment
-
Cloud-Based Deployment
-
Hybrid Deployment
By Organization Size
-
Small & Medium-sized Enterprises
-
Large Enterprises
By End-User
-
BFSI
-
Retail
-
eCommerce
-
Telecom & IT
-
Healthcare
-
Pharmaceuticals & Life Sciences
-
Government & Public Sector
-
Manufacturing & Automotive
-
Media & Entertainment
-
Energy & Utilities
-
Travel & Hospitality
-
Transportation & Logistics
-
Others
By Region
-
North America
-
The U.S.
-
Canada
-
Mexico
-
-
Europe
-
The UK
-
Germany
-
France
-
Italy
-
Spain
-
Denmark
-
Netherlands
-
Finland
-
Sweden
-
Norway
-
Russia
-
Rest of Europe
-
-
Asia-Pacific
-
China
-
Japan
-
India
-
South Korea
-
Australia
-
Indonesia
-
Singapore
-
Taiwan
-
Thailand
-
Rest of Asia-Pacific
-
-
RoW
-
Latin America
-
Middle East
-
Africa
-
REPORT SCOPE AND SEGMENTATION:
|
Parameters |
Details |
|
Market Size in 2023 |
USD 3.44 Billion |
|
Revenue Forecast in 2030 |
USD 13.26 Billion |
|
Growth Rate |
21.% from 2024 to 2030 |
|
Analysis Period |
2023–2030 |
|
Base Year Considered |
2023 |
|
Forecast Period |
2024–2030 |
|
Market Size Estimation |
Billion (USD) |
|
Growth Factors |
|
|
Countries Covered |
28 |
|
Companies Profiled |
10 |
|
Market Share |
Available for 10 companies |
|
Customization Scope |
Free customization (equivalent to up to 80 working hours of analysts) after purchase. Addition or alteration to country, regional, and segment scope. |
|
Pricing and Purchase Options |
Avail customized purchase options to meet your exact research needs. |
KEY PLAYERS
-
Neo4j Inc.
-
Amazon Neptune
-
ArangoDB GmbH
-
DataStax, Inc.
-
OrientDB Ltd.
-
Stardog Union, Inc.
-
Microsoft Corporation
-
Dgraph Labs, Inc.
-
TigerGraph, Inc.
-
Kobai, Inc.


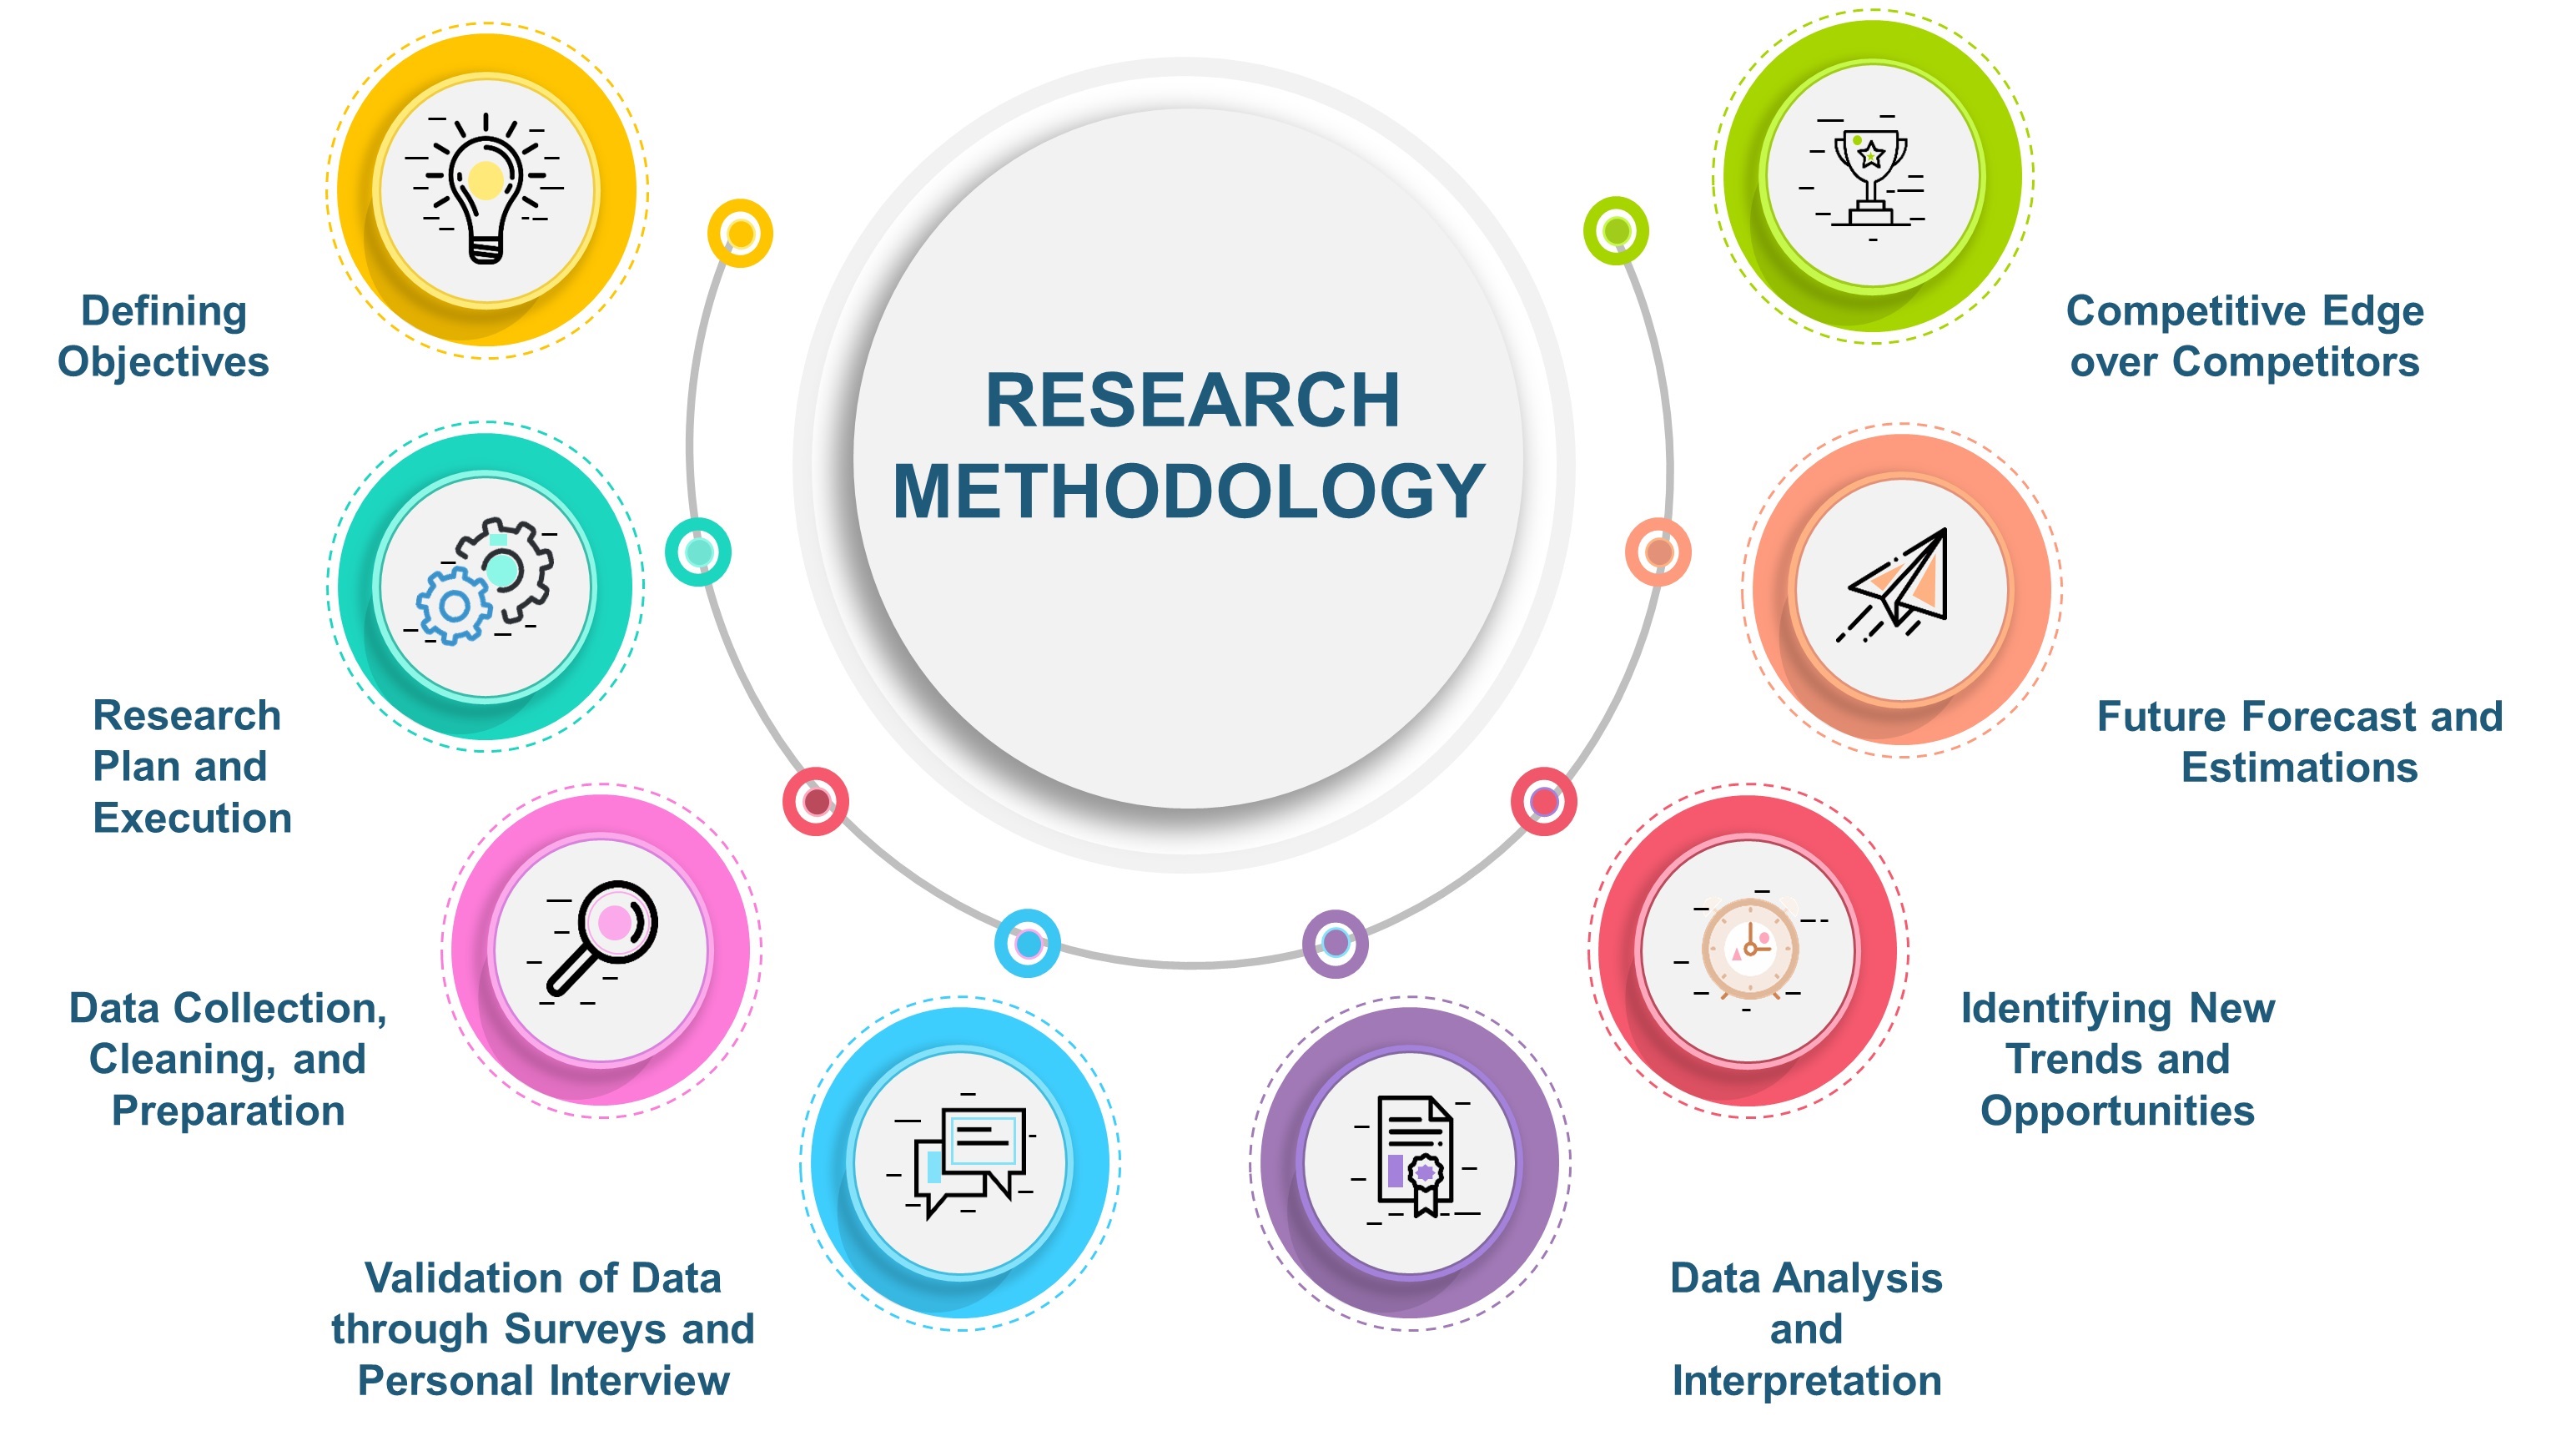
At Next Move Strategy Consulting, we understand that insightful market research is the cornerstone of successful business decisions. That's why we employ a robust and multifaceted approach, combining various methodologies to deliver the most accurate and actionable data for our clients.
Research Landscape
We navigate the world of research with two primary approaches:
Qualitative Approach
Our qualitative research methodologies involve immersive techniques such as in-depth interviews, focus groups, and observational studies. By engaging directly with individuals and stakeholders, we uncover valuable insights that quantitative data alone may overlook.
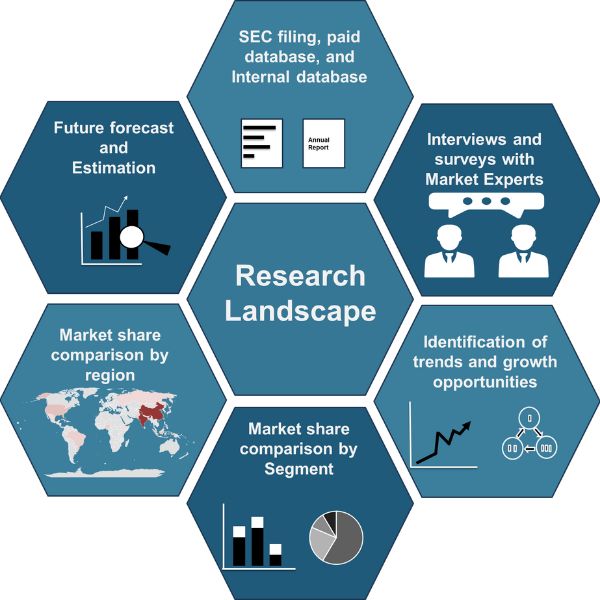
Quantitative Research
In tandem with qualitative methodologies, NMSC leverages the power of Quantitative Research to provide a robust foundation of numerical insights. Through systematic data collection and analysis, we quantify patterns, preferences, and market trends, offering a comprehensive view of the business landscape.
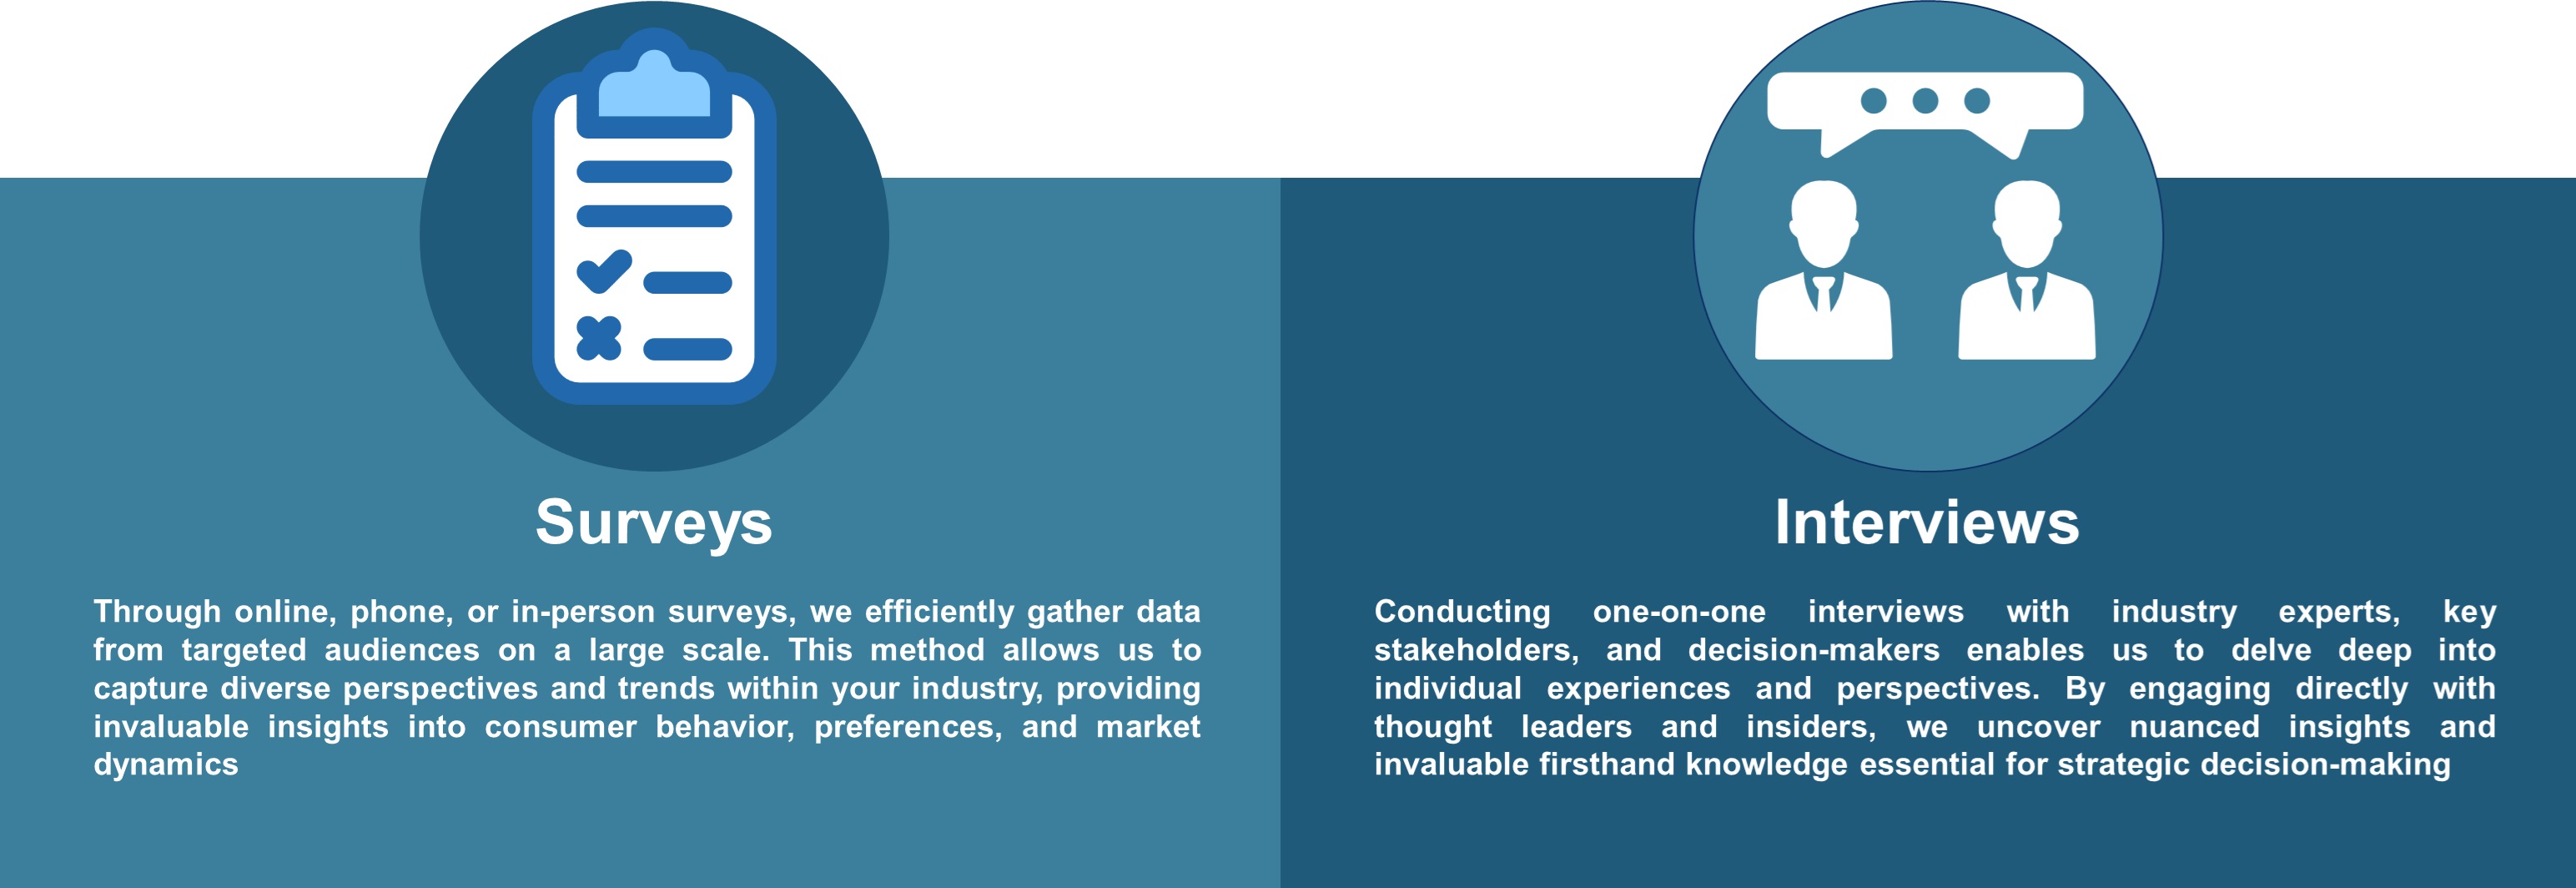
Our quantitative research approach employs diverse tools, including surveys, experiments, and statistical modelling. These methodologies enable us to gather data from a large and representative sample, ensuring the statistical significance of our findings. By employing structured questionnaires and standardized data collection methods, we guarantee the reliability and validity of the information we present to our clients.
Quantitative research is particularly effective in measuring the prevalence of trends, assessing market size, and gauging the impact of various factors on consumer behavior. The numerical precision attained through this approach equips our clients with actionable insights, facilitating data-driven decision-making and strategy formulation.
Our Specialized Toolbox for Industry-Specific Market Research
We deploy a specialized arsenal of techniques tailored to meet your unique requirements. Here's a glimpse into our comprehensive toolbox:
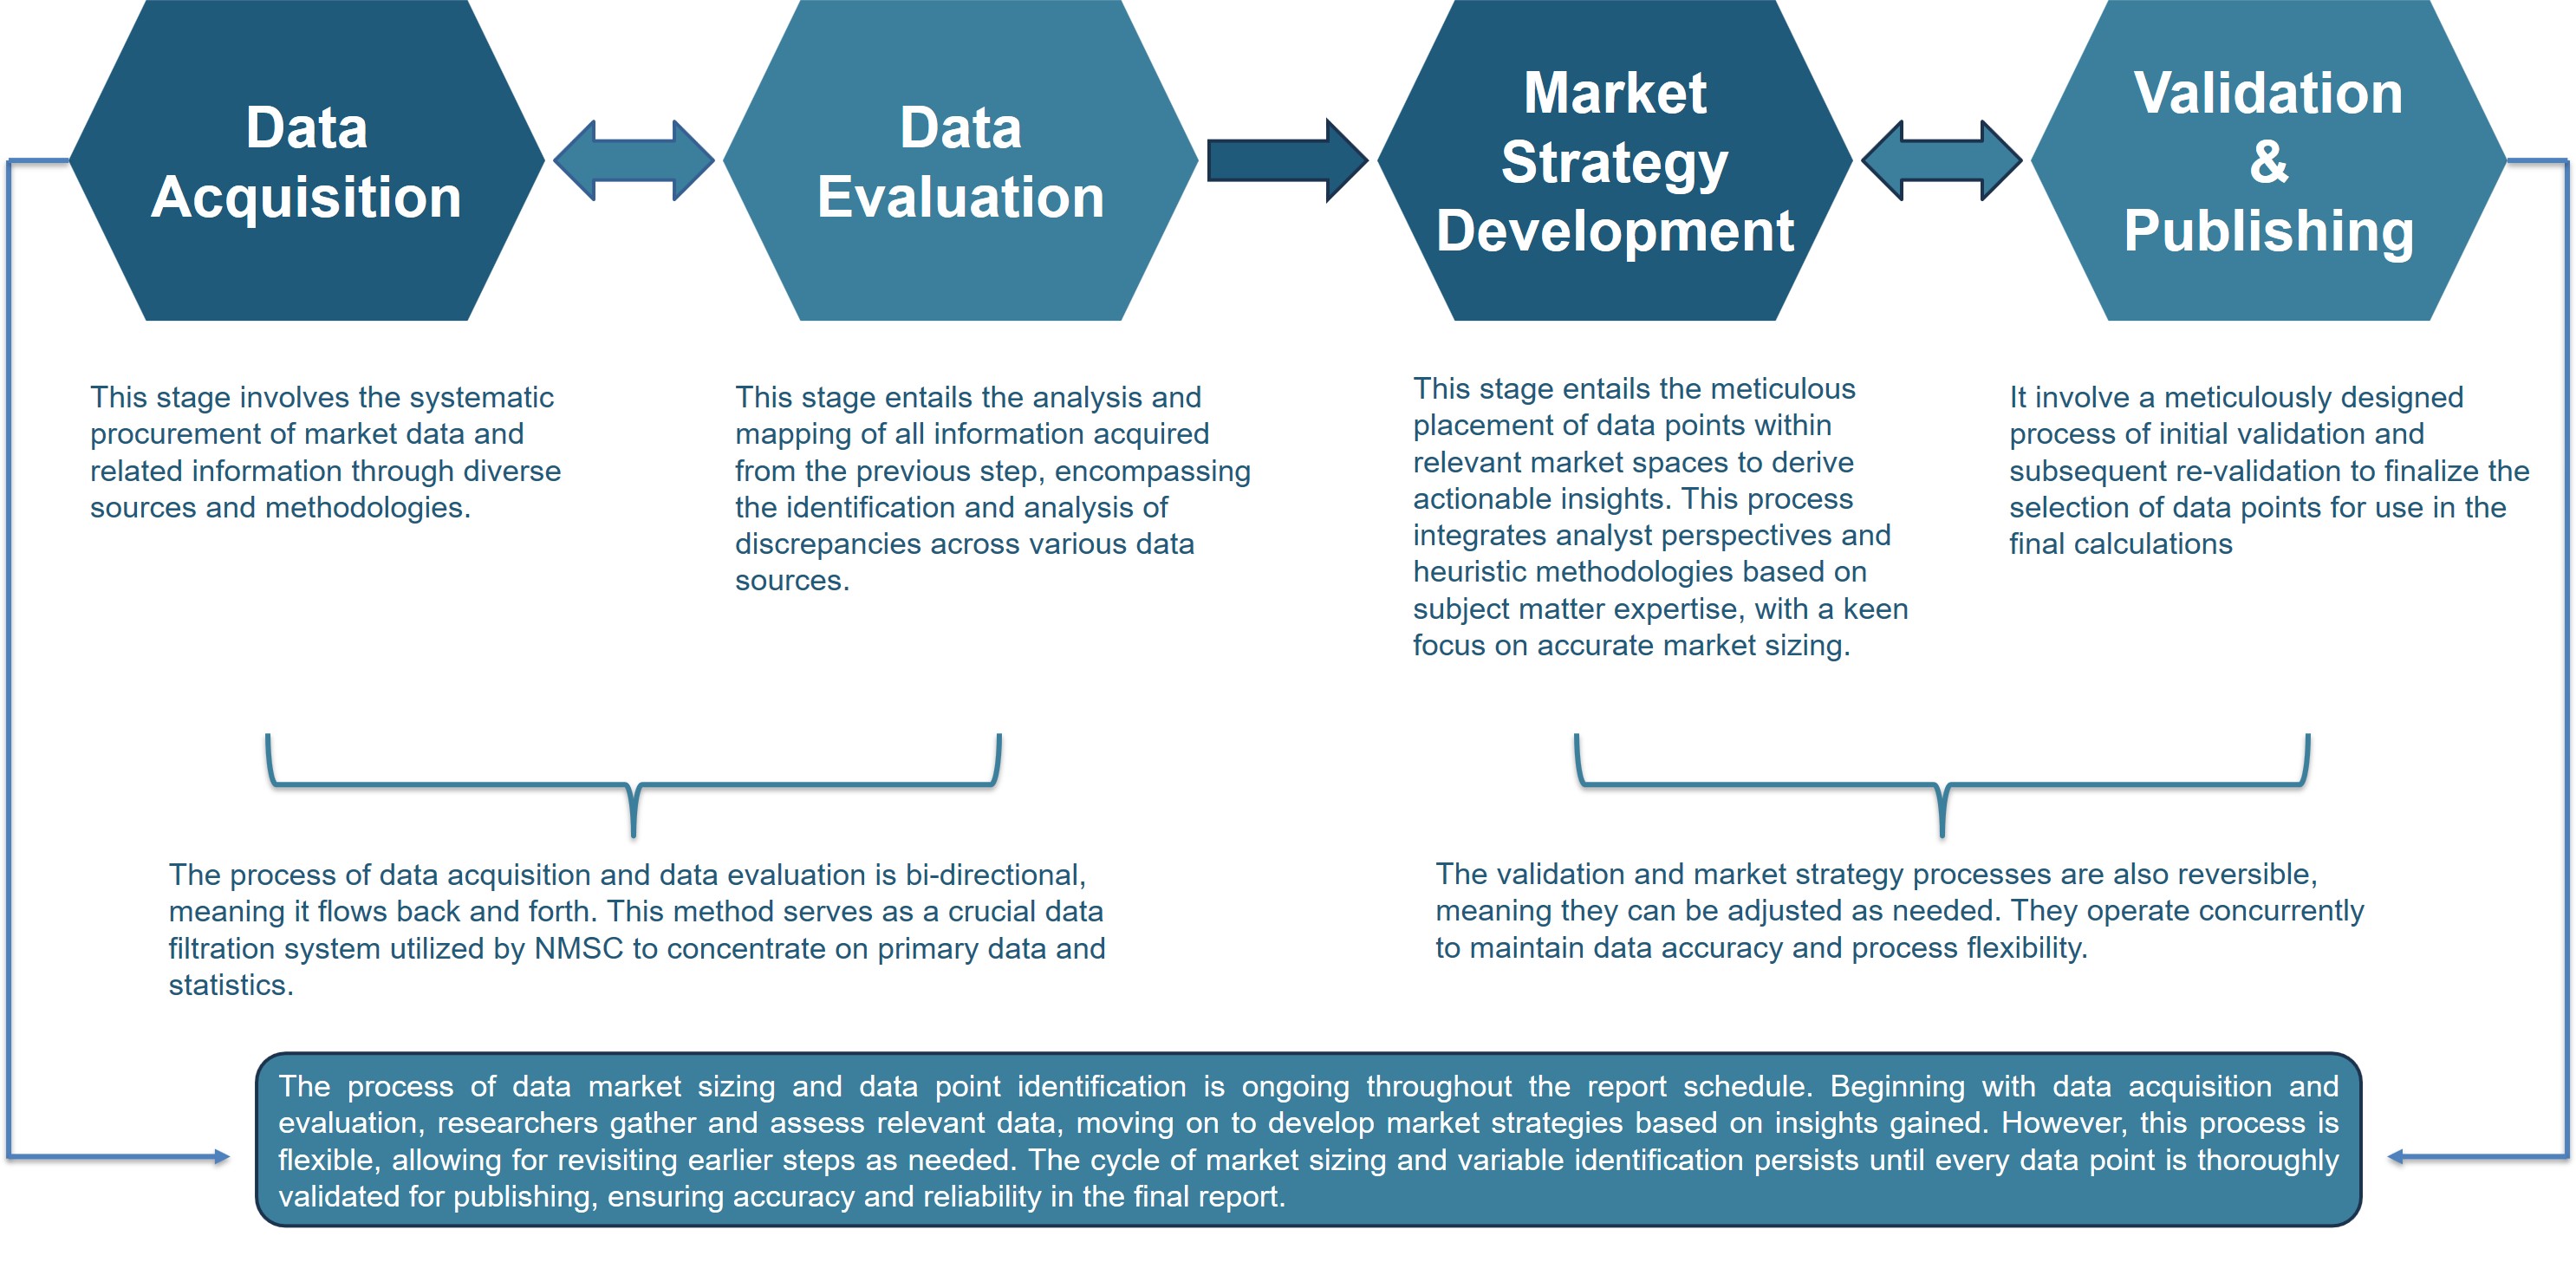
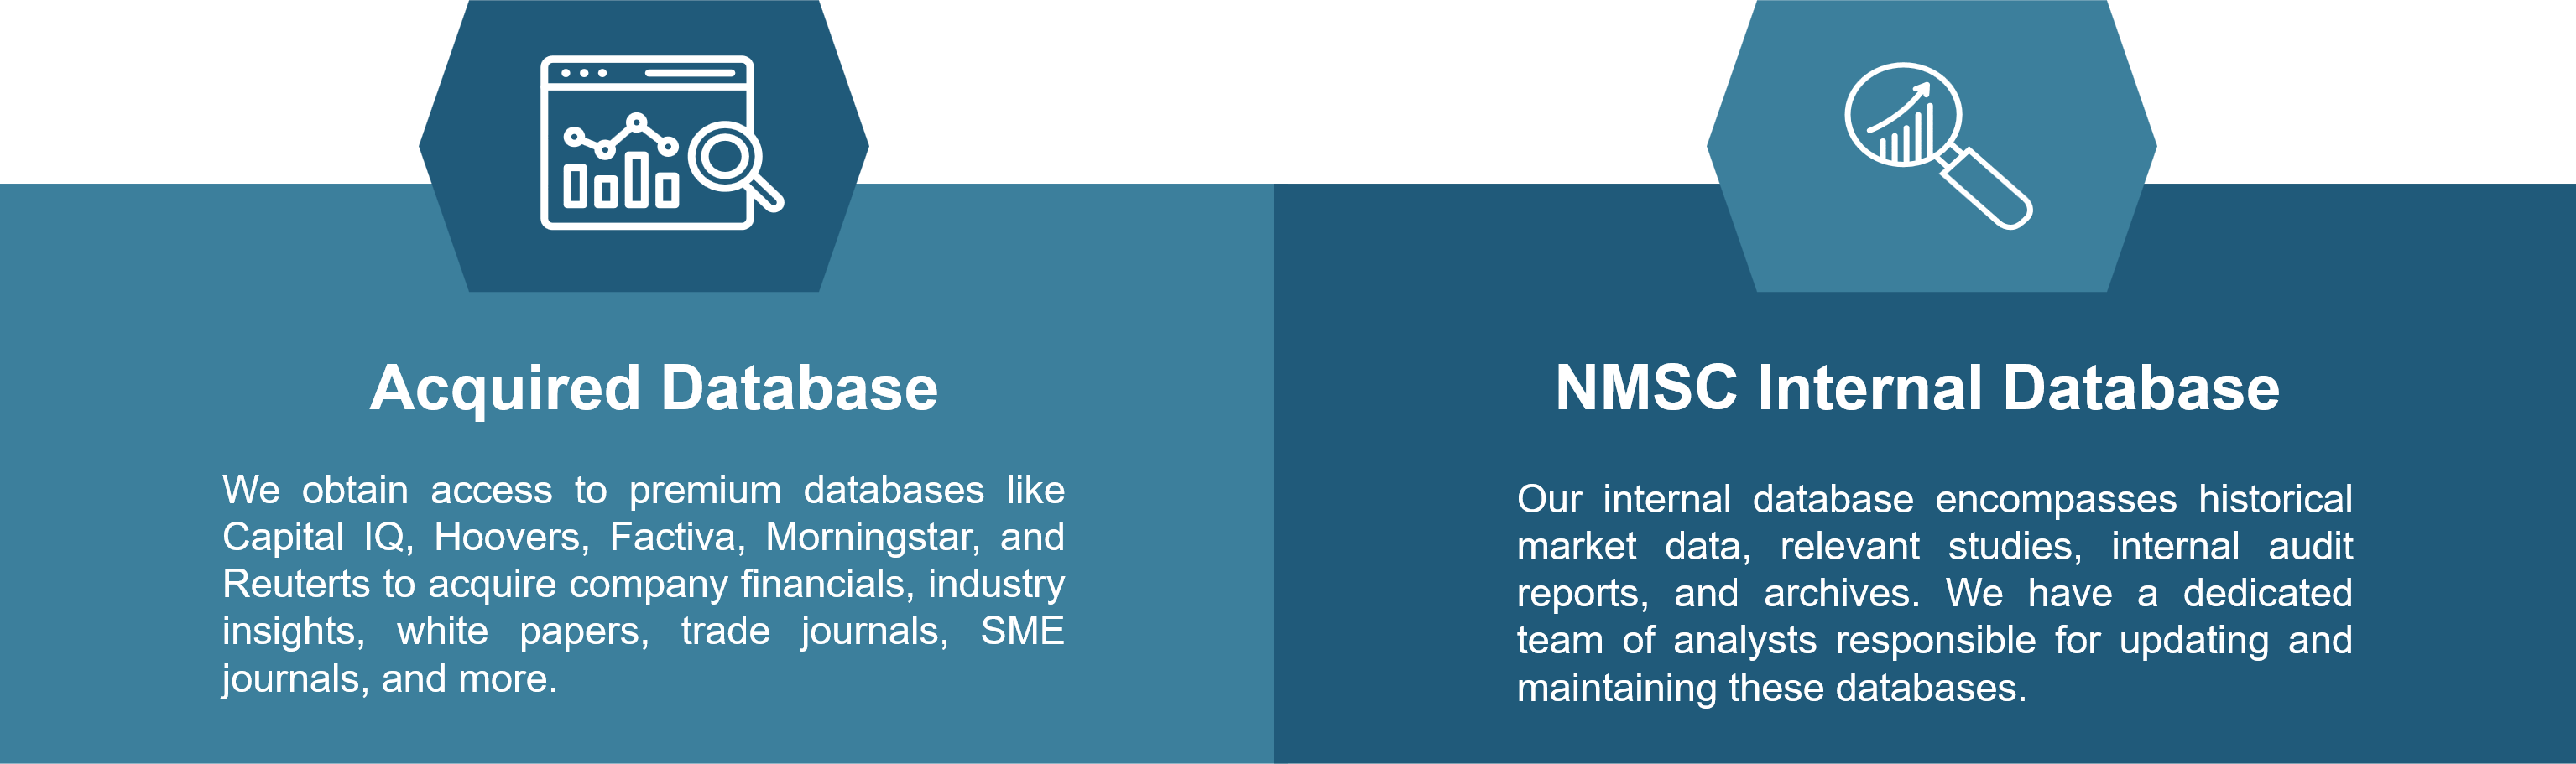
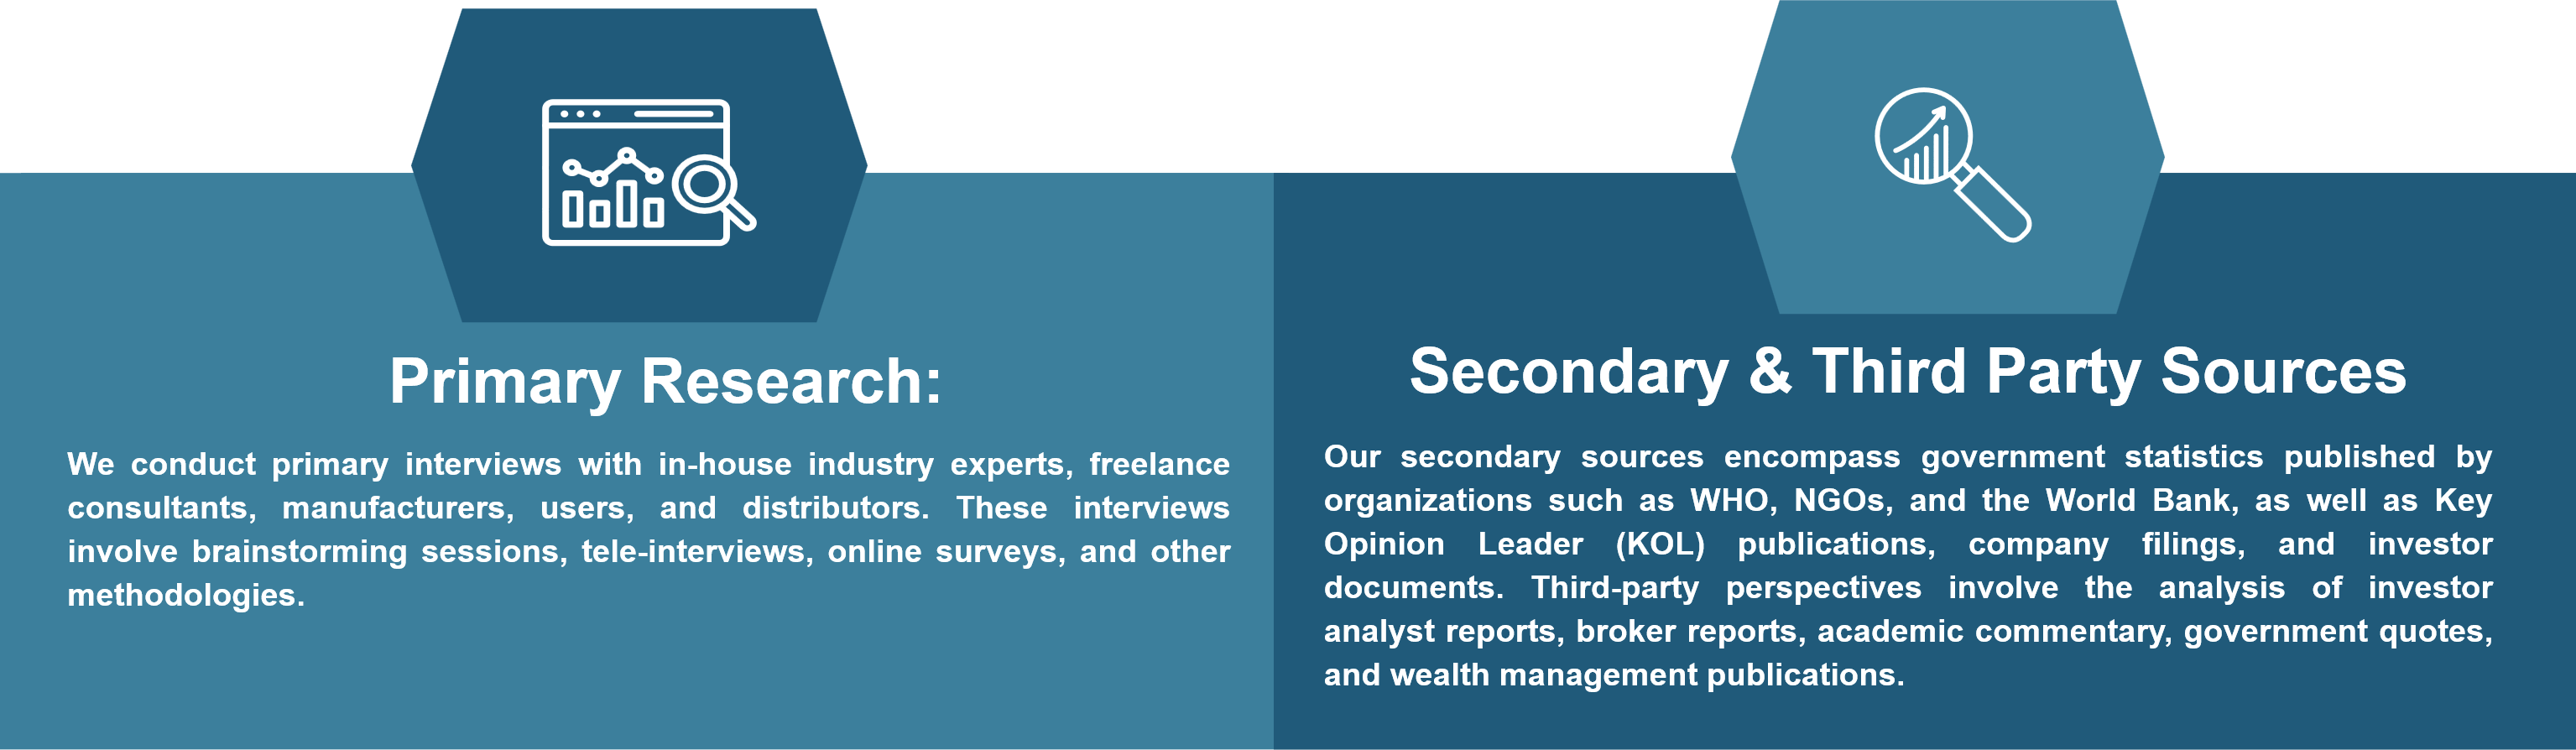
Information Procurement
The stage entails acquiring market data or relevant information through various sources and methodologies.
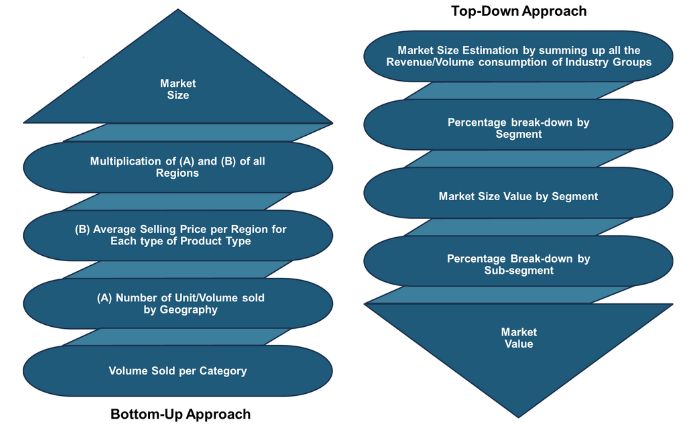
Market Research Approach
We utilize both top-down and bottom-up approaches in market research analysis to achieve a comprehensive understanding of the market dynamics, leveraging the broad perspective of industry trends and macroeconomic factors alongside detailed insights from specific segments and individual companies.
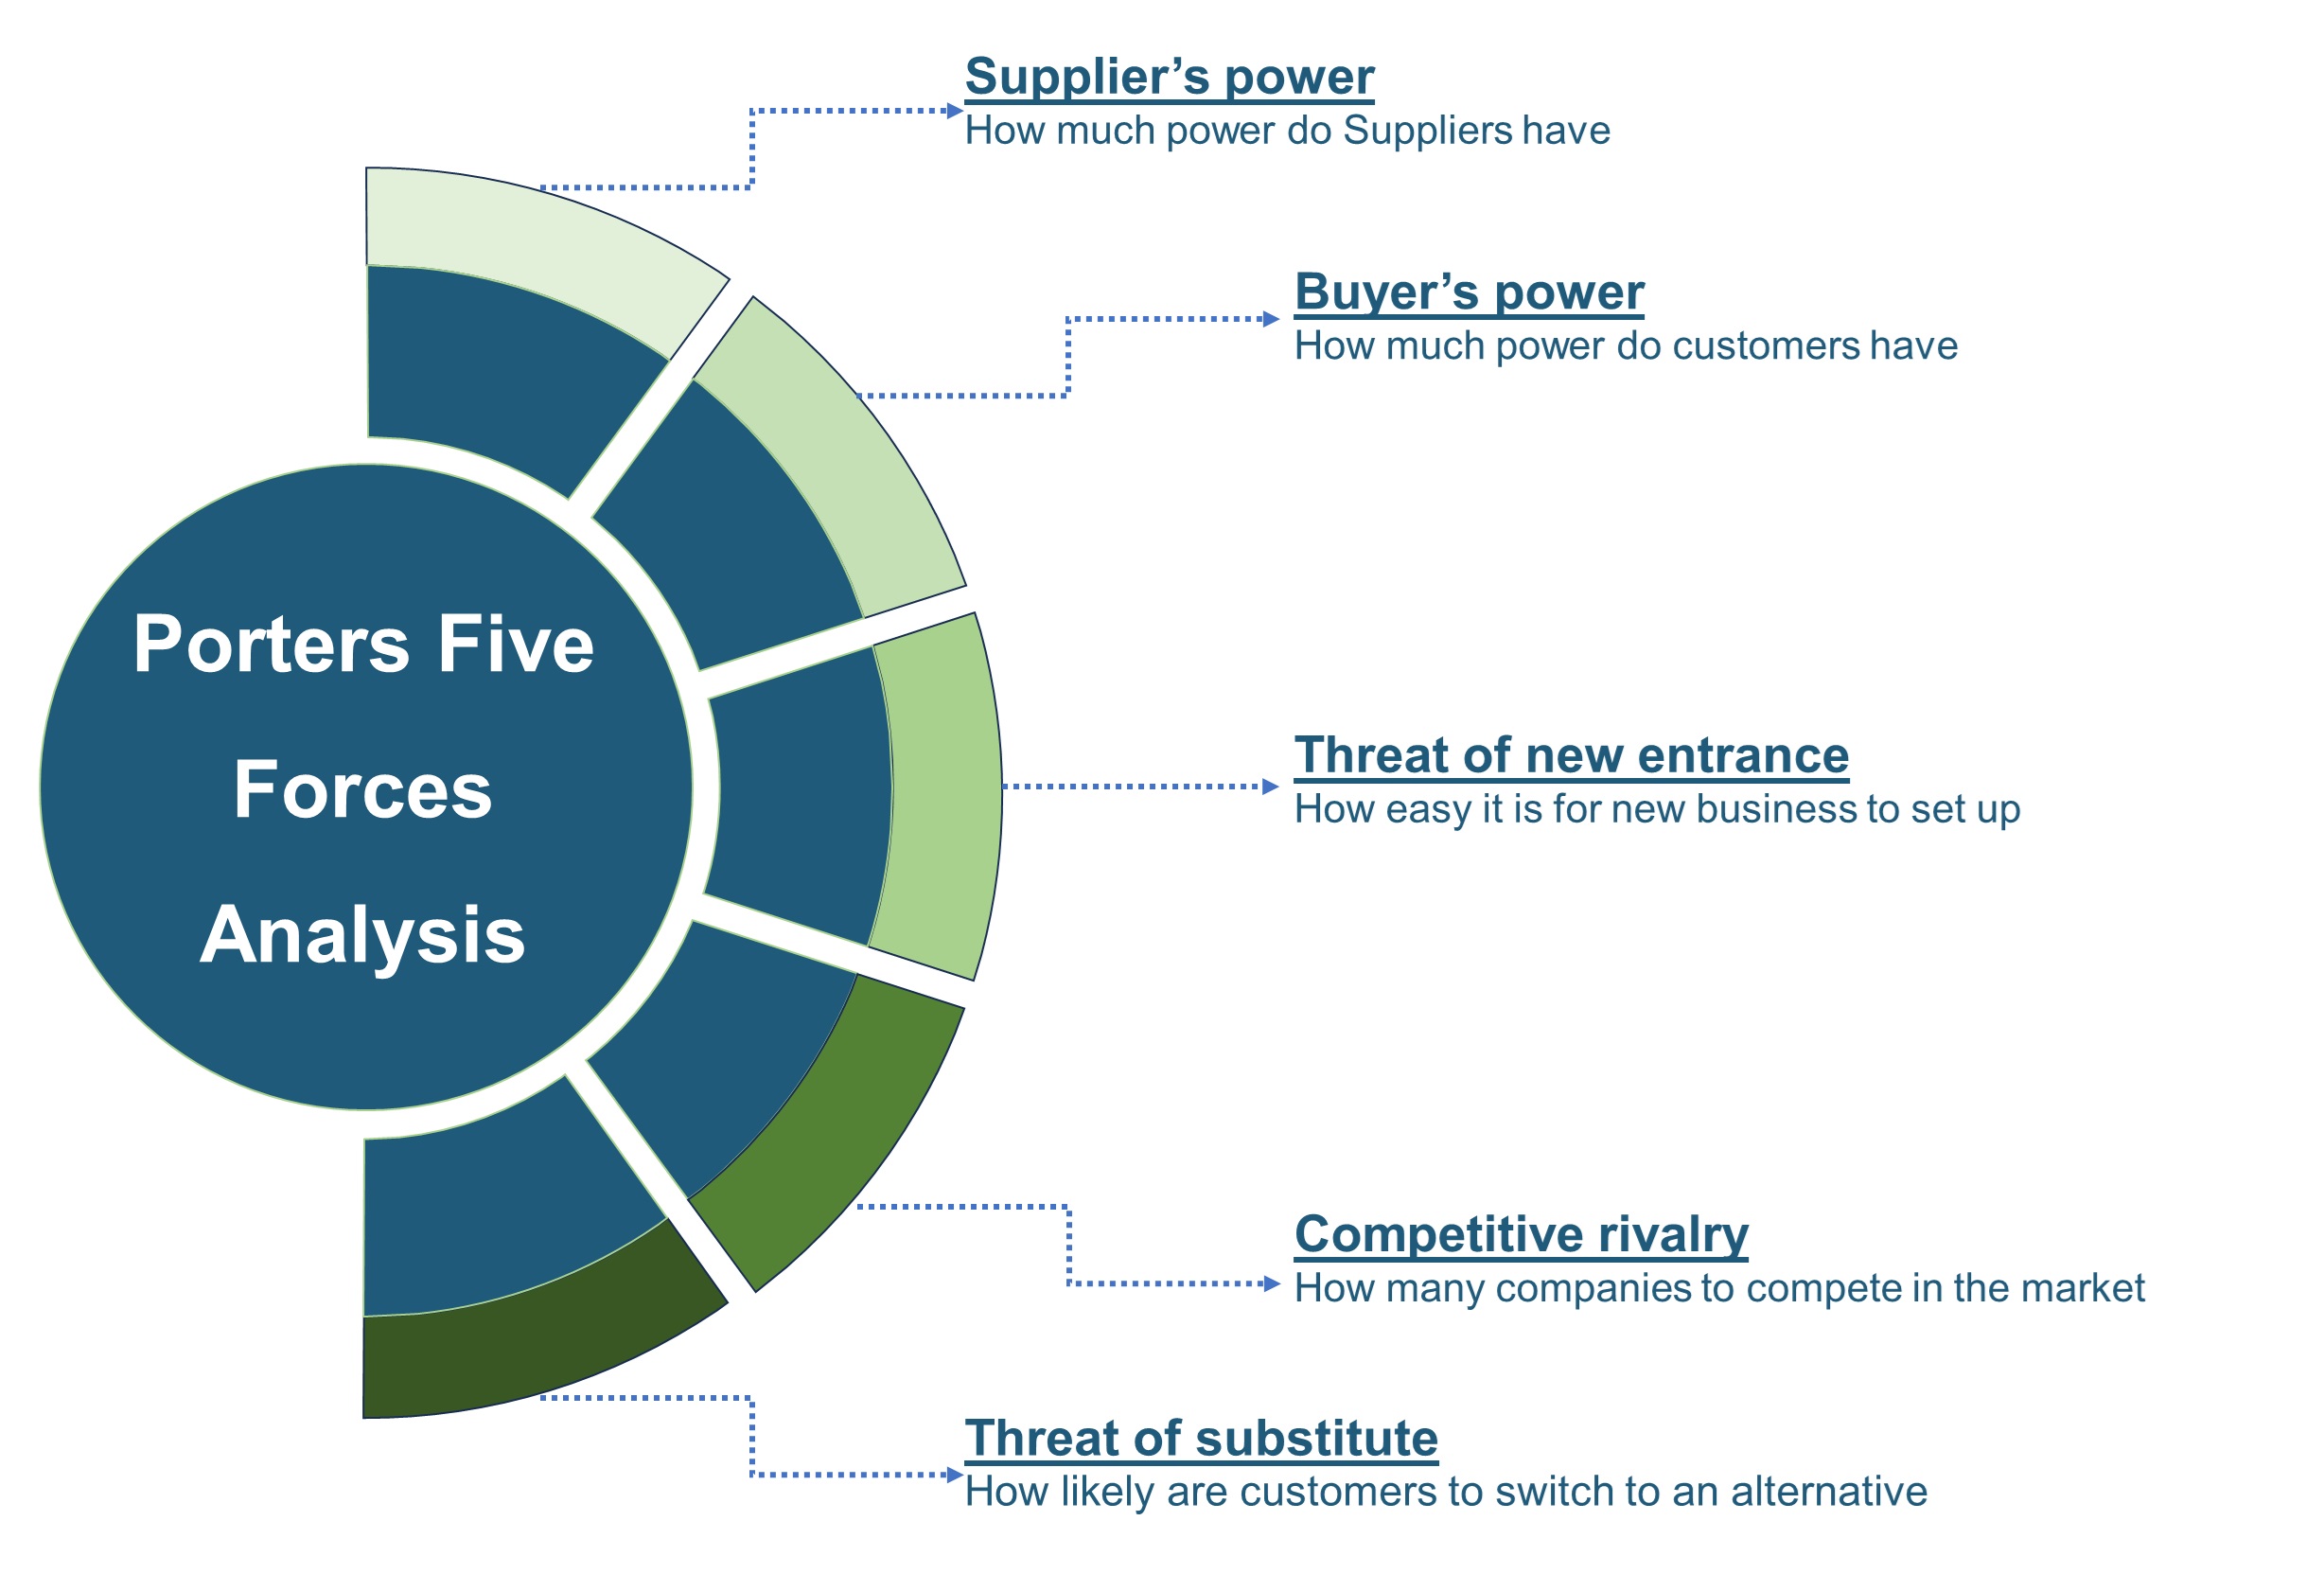
Porters Five Forces Analysis
We conduct Porter's Five Forces analysis to evaluate the competitive landscape of an industry, providing us with insights into factors that affect profitability and strategic positioning.
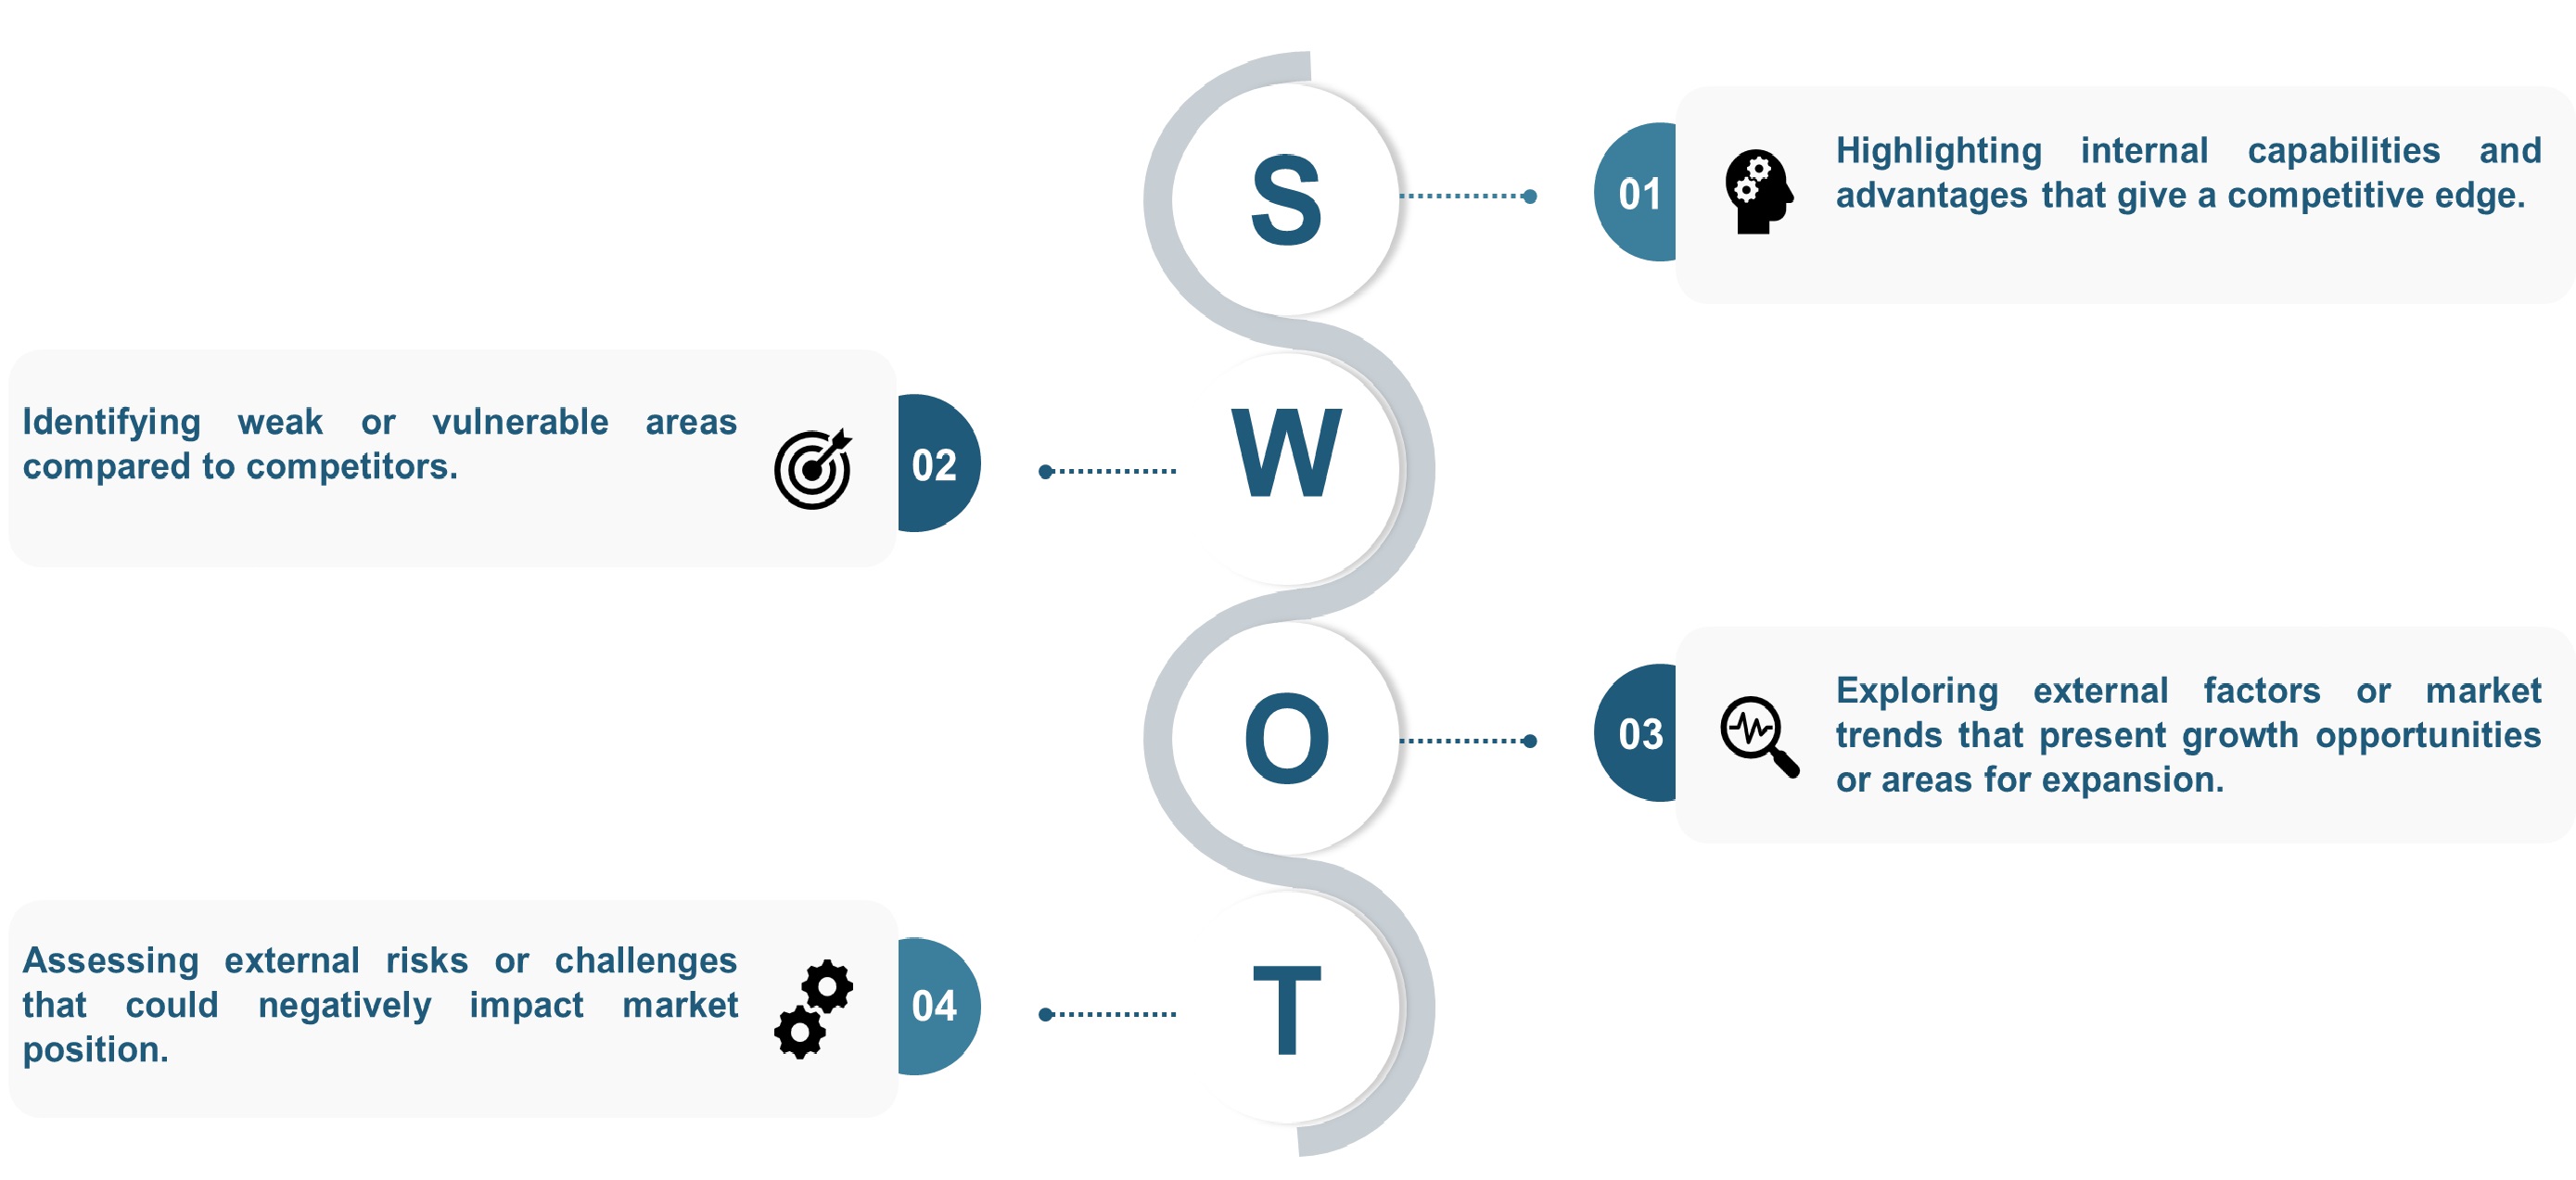
SWOT Analysis
We conduct SWOT analysis to understand market trends, identify potential threats, capitalize on opportunities, and assess our strengths and weaknesses.
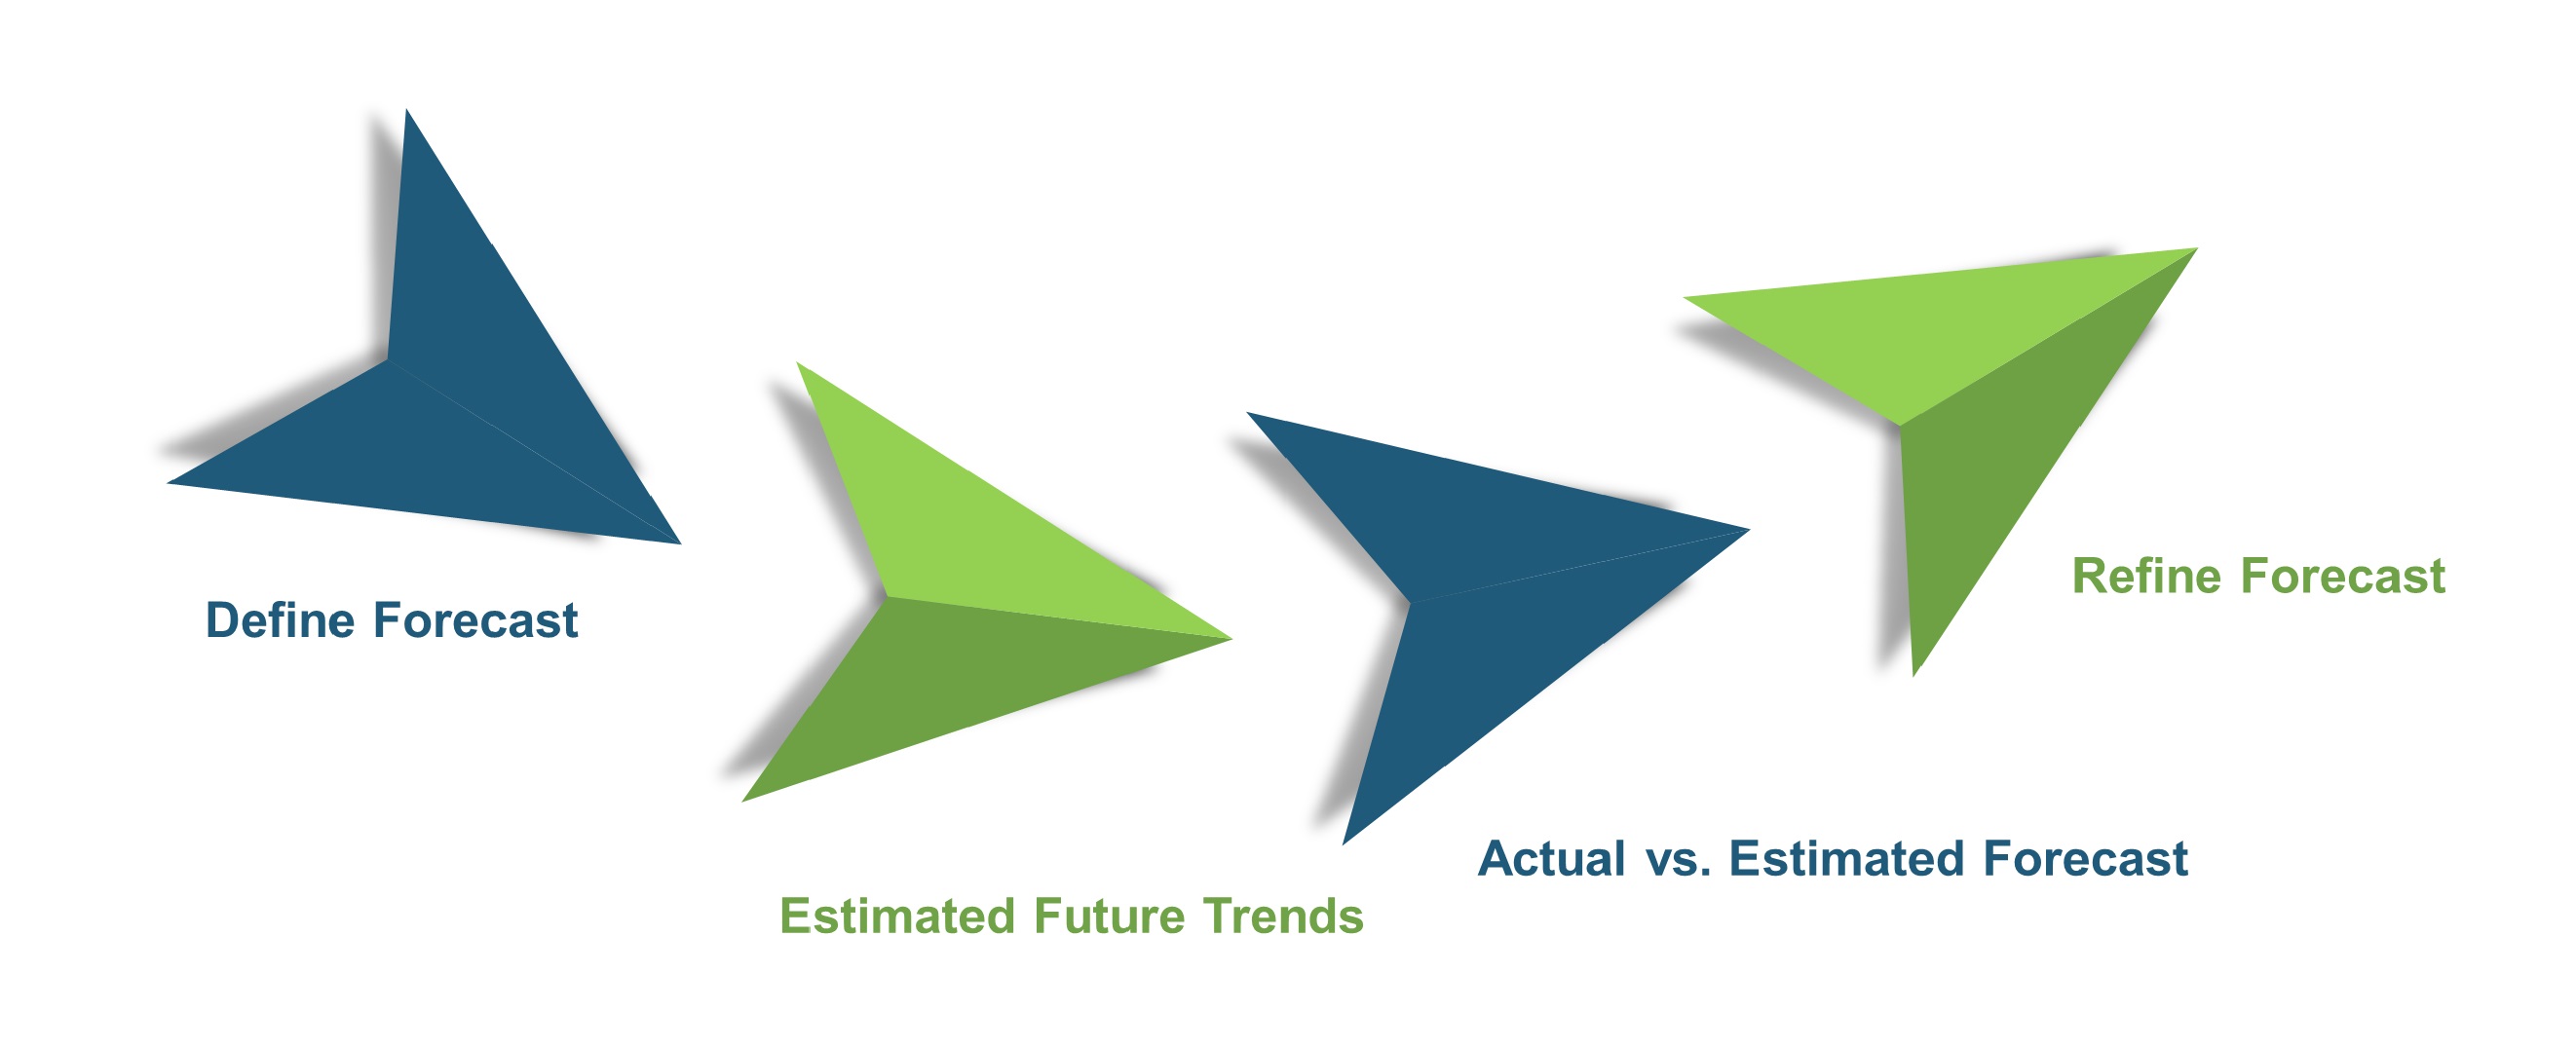
Forecasting
We utilize a forecasting model to predict future consumption by considering parameters like population, economics, regulations, market competition, drivers, constraints, technology, and pricing. We also employ statistical techniques such as multilinear regression, exponential smoothing, moving average, ARIMA, and Monte Carlo simulations for accurate predictions. In econometric forecasting, we analyzed short-term and long-term event impacts, attributing values based on regulatory frameworks, economic factors, and market events.
Download Free Sample
Frequently Asked Questions
 Speak to Our Analyst


Related Blogs
How Collaborative Robots are Shaping Warehouse Operations
Collaborative robots are used in warehouse operations to revolutionize supply ch...


How Kion, Honeywell, & ABB Lead Warehouse Automation Trends
Next Move Strategy Consulting forecasts that the Warehouse Automation Market wil...

Who’s Leading in Robot Vacuums? Top 10 Innovators Revealed
Next Move Strategy Consulting states that the global robot vacuum cleaner market...