Nanotechnology Market Global Industry Analysis and Forecast (2026-2035)

Nanotechnology Market size was USD 108.52 billion in 2025, projected to reach USD 355.54 billion by 2035, growing at a CAGR of 12.6% from 2026 to 2035. Key drivers include expanding carbon nanomaterial manufacturing capacity, rising nanomedicine clinical pipeline advancement, and growing nanoelectronics demand from semiconductor scaling, with Asia-Pacific leading the market.

Download Free Sample PDF
Base Year (2025)
$108.52 Billion
Forecast (2035)
$355.54 Billion
CAGR (2026-2035)
12.6%
Top Region
Asia-Pacific

What Is the Nanotechnology Market Size?

The Nanotechnology Market size was valued at USD 108.52 Billion in 2025 and is estimated at USD 122.19 Billion in 2026, forecast to reach USD 355.54 Billion by 2035, expanding at a 12.6% CAGR between 2026 and 2035. Asia-Pacific leads with approximately 42% share, while Nanomaterials dominate all offering categories with approximately 31% share.

We observed that growth is concentrated in nano-enabled components and finished products, with carbon nanomaterial capacity expansion and clinical-stage nanomedicine progress gaining disproportionate momentum against legacy nanotools and instrumentation revenue through 2035.

Nanotechnology Market Global Industry Analysis and Forecast (2026-2035) Revenue Forecast

Values in USD Billion

2025 $108.52 Billion
2025
2026 $122.19 Billion
2026
2027 $137.59 Billion
2027
2028 $154.92 Billion
2028
2029 $174.44 Billion
2029
2030 $196.42 Billion
2030
2031 $221.17 Billion
2031
2032 $249.04 Billion
2032
2033 $280.42 Billion
2033
2034 $315.75 Billion
2034
2035 $355.54 Billion
2035

Key Takeaways

By Offering: Nanomaterials held the largest share of approximately 31% (USD 33.65 Billion) in 2025; Nano-enabled Finished Products is the fastest-growing sub-segment at 15.05% CAGR from 2026–2035.

By End Use: Electronics and IT held the largest share of approximately 24% (USD 26.02 Billion) in 2025; Healthcare and Life Sciences is the fastest-growing sub-segment at 14.45% CAGR from 2026–2035.

By Technology: Bottom-up Techniques held the largest share of approximately 56% (USD 60.77 Billion) in 2025 and is also the fastest-growing sub-segment at 13.47% CAGR from 2026–2035.

By Buyer Type: Industrial End User held the largest share of approximately 36% (USD 39.07 Billion) in 2025; Healthcare Provider is the fastest-growing sub-segment at 18.18% CAGR from 2026–2035.

By Distribution Channel: Direct Sales held the largest share of approximately 54% (USD 58.60 Billion) in 2025; E-Commerce is the fastest-growing sub-segment at 21.62% CAGR from 2026–2035.

Dominant Region: Asia-Pacific dominated with approximately 42% revenue share (USD 45.58 Billion) in 2025.

Fastest-Growing Region: Asia-Pacific is also expected to register the highest CAGR of 14.55% during 2026–2035.

Dominant Country: China led the market with approximately USD 20.06 Billion in 2025.

Fastest-Growing Country: India is expected to register the highest CAGR of approximately 18.2% during 2026–2035.

Market Opportunity: The Nanotechnology market is expected to create an absolute dollar opportunity of USD 233.35 Billion between 2026 and 2035, presenting significant investment potential across nano-enabled components and clinical-stage nanomedicine platforms.

According to NMSC analysis, carbon nanomaterial producers are increasingly investing in large-scale, energy-efficient manufacturing hubs to move beyond pilot-scale capacity, a shift that favors vendors with demonstrated commercial-scale production over research-stage suppliers as battery, composite, and coating end markets scale their carbon nanomaterial consumption through 2035.

What Does the Nanotechnology Market Encompass?

The Nanotechnology Market encompasses materials, formulated products, components, finished products, tools, and services engineered at the nanoscale to deliver enhanced mechanical, electrical, optical, or biological performance. Our assessment indicates that the scope spans carbon nanomaterials, inorganic and polymer nanomaterials, nanocomposites and nanocoatings, nanoelectronics and nanosensors, nano-enabled medical and energy products, microscopy and lithography instruments, and contract research services supplied to OEMs, foundries, research institutes, and healthcare providers.

Regulatory frameworks including the U.S. Food and Drug Administration's nanomaterial-specific guidance and the European Union's REACH nanomaterial registration requirements increasingly shape product approval and material characterization standards. We observed that technology adoption is shifting from top-down lithographic fabrication toward bottom-up self-assembly and chemical synthesis methods capable of scaling carbon nanomaterial and nanomedicine production more cost-effectively. NMSC's analysis indicates that this structural shift, combined with expanding clinical-stage nanomedicine pipelines, is redefining supplier qualification criteria across the nanotechnology value chain.

Market Drivers & Dynamics

Interactive Dataset
Expanding carbon nanomaterial manufacturing capacity driver +2.9% Europe, Asia-Pacific 2026-2035
Rising nanomedicine clinical pipeline advancement driver +2.3% North America, Europe 2026-2035
Growing nanoelectronics demand from semiconductor scaling driver +1.8% Asia-Pacific 2026-2035
Expanding nano-enabled battery and energy component demand driver +1.5% Global 2026-2035
Rising government nanotechnology research funding driver +1.0% North America, Asia-Pacific 2026-2032
Growing environmental and water treatment nanomaterial adoption driver +0.7% Global 2028-2035
Regulatory uncertainty around nanomaterial safety characterization restraint -1.4% Global 2026-2032
High capital cost of commercial-scale nanomaterial production restraint -1.0% Global 2026-2032
Limited standardization of nanomaterial characterization methods restraint -0.6% Global 2026-2030
Source: Next Move Strategy Consulting

Growth Drivers

What Is the Primary Growth Driver of the Nanotechnology Market?

Expanding carbon nanomaterial manufacturing capacity is the primary driver of the market. OCSiAl Group's planned USD 300 million Luxembourg graphene nanotube facility, alongside its existing Serbian production site, continues to expand global single-wall carbon nanotube supply capacity. We observed that this capacity expansion, reinforced by rising battery and composite material demand, continues to anchor baseline growth for carbon-based nanomaterials across the broader nanomaterials segment.

How Is Nanomedicine Clinical Progress Driving Market Growth?

Advancing clinical-stage nanomedicine pipelines are accelerating market growth as combination therapeutics move toward potential regulatory approval. Nanobiotix's JNJ-1900 program continued generating positive Phase 1 combination data across melanoma and head and neck cancer indications through late 2025, with its pivotal Phase 3 trial advancing under Johnson & Johnson's sponsorship. Our assessment indicates that this clinical progress is compressing investor timelines for pharmaceutical drug delivery-adjacent nanomedical product commercialization.

Growth Inhibitors

What Is Restraining Nanotechnology Market Expansion?

Regulatory uncertainty around nanomaterial safety characterization restrains commercialization timelines across multiple jurisdictions. The U.S. Food and Drug Administration has issued guidance addressing drug products containing nanomaterials, including considerations for characterization, controls, testing, and qualification of nanomaterial components. We found that this regulatory uncertainty disproportionately affects smaller nanomaterial developers with limited regulatory affairs capacity compared with large, diversified specialty chemical and pharmaceutical companies.
Segmentation Analysis

2025 (USD Billion)
2035 (USD Billion)
Nanomaterials 2025: $33.65 Billion | 2035: $96.00 Billion
Nanomaterial
Formulated Materials 2025: $23.87 Billion | 2035: $74.66 Billion
Formulated M
Nano-enabled Components 2025: $20.62 Billion | 2035: $78.22 Billion
Nano-enabled
Nano-enabled Finished Products 2025: $15.19 Billion | 2035: $60.44 Billion
Nano-enabled
Nanotools and Instruments 2025: $10.85 Billion | 2035: $32.00 Billion
Nanotools an
Nano Services 2025: $4.34 Billion | 2035: $14.22 Billion
Nano Service
Nanomaterials $33.65 Billion $96.00 Billion 10.89%
Formulated Materials $23.87 Billion $74.66 Billion 12.02%
Nano-enabled Components $20.62 Billion $78.22 Billion 14.45%
Nano-enabled Finished Products $15.19 Billion $60.44 Billion 15.05%
Nanotools and Instruments $10.85 Billion $32.00 Billion 11.29%
Nano Services $4.34 Billion $14.22 Billion 12.59%

Which Offering Segment Dominates the Nanotechnology Market?

Nanomaterials led the market with USD 33.65 Billion in 2025, supported by sustained demand for graphene, metal oxide, and silica-based nanomaterials across formulation and component manufacturing. We observed that Nano-enabled Finished Products is the fastest-growing offering, expanding at a 15.05% CAGR from 2026 to 2035, as nanomedical and energy products advance from clinical and pilot stages toward broader commercial adoption.

2025 (USD Billion)
2035 (USD Billion)
Electronics
Healthcare a
Energy and U
Automotive
Aerospace an
Segment Item 2025 (USD Billion) 2035 (USD Billion) CAGR
Electronics and IT $10.0 USD Billion $40.0 USD Billion 15.0%
Healthcare and Life Sciences $17.1 USD Billion $51.1 USD Billion 13.0%
Energy and Utilities $24.2 USD Billion $62.2 USD Billion 23.0%
Automotive $31.3 USD Billion $73.3 USD Billion 9.0%
Aerospace and Defense $38.4 USD Billion $84.4 USD Billion 18.0%

Segment-wise data is locked

Unlock complete segment-wise numbers for By End Use.

Unlock Full Data

Which End Use Segment Leads the Nanotechnology Market?

Electronics and IT led the market with USD 26.02 Billion in 2025, supported by sustained nanoelectronics and nanophotonics demand across semiconductor manufacturing. Healthcare and Life Sciences is the fastest-growing end use, expanding at a 14.45% CAGR from 2026 to 2035, as clinical-stage nanomedicine programs advance and diagnostic nanosensor adoption expands, complementing broader water treatment and environmental applications gaining traction in parallel.

2025 (USD Billion)
2035 (USD Billion)
Top-down Tec
Lithography
Etching
Deposition
Other Top-do
Segment Item 2025 (USD Billion) 2035 (USD Billion) CAGR
Top-down Techniques $10.0 USD Billion $40.0 USD Billion 16.0%
Lithography $17.1 USD Billion $51.1 USD Billion 22.0%
Etching $24.2 USD Billion $62.2 USD Billion 16.0%
Deposition $31.3 USD Billion $73.3 USD Billion 26.0%
Other Top-down Techniques $38.4 USD Billion $84.4 USD Billion 25.0%

Segment-wise data is locked

Unlock complete segment-wise numbers for By Technology.

Unlock Full Data
2025 (USD Billion)
2035 (USD Billion)
OEM
Foundry
Research Ins
Industrial E
Healthcare P
Segment Item 2025 (USD Billion) 2035 (USD Billion) CAGR
OEM $10.0 USD Billion $40.0 USD Billion 22.0%
Foundry $17.1 USD Billion $51.1 USD Billion 12.0%
Research Institute $24.2 USD Billion $62.2 USD Billion 14.0%
Industrial End User $31.3 USD Billion $73.3 USD Billion 12.0%
Healthcare Provider $38.4 USD Billion $84.4 USD Billion 15.0%

Segment-wise data is locked

Unlock complete segment-wise numbers for By Buyer Type.

Unlock Full Data
2025 (USD Billion)
2035 (USD Billion)
Direct Sales
Distributor
E-Commerce
Project-Base
Other Channe
Segment Item 2025 (USD Billion) 2035 (USD Billion) CAGR
Direct Sales $10.0 USD Billion $40.0 USD Billion 25.0%
Distributor $17.1 USD Billion $51.1 USD Billion 19.0%
E-Commerce $24.2 USD Billion $62.2 USD Billion 25.0%
Project-Based $31.3 USD Billion $73.3 USD Billion 19.0%
Other Channels $38.4 USD Billion $84.4 USD Billion 20.0%

Segment-wise data is locked

Unlock complete segment-wise numbers for By Distribution Channel.

Unlock Full Data

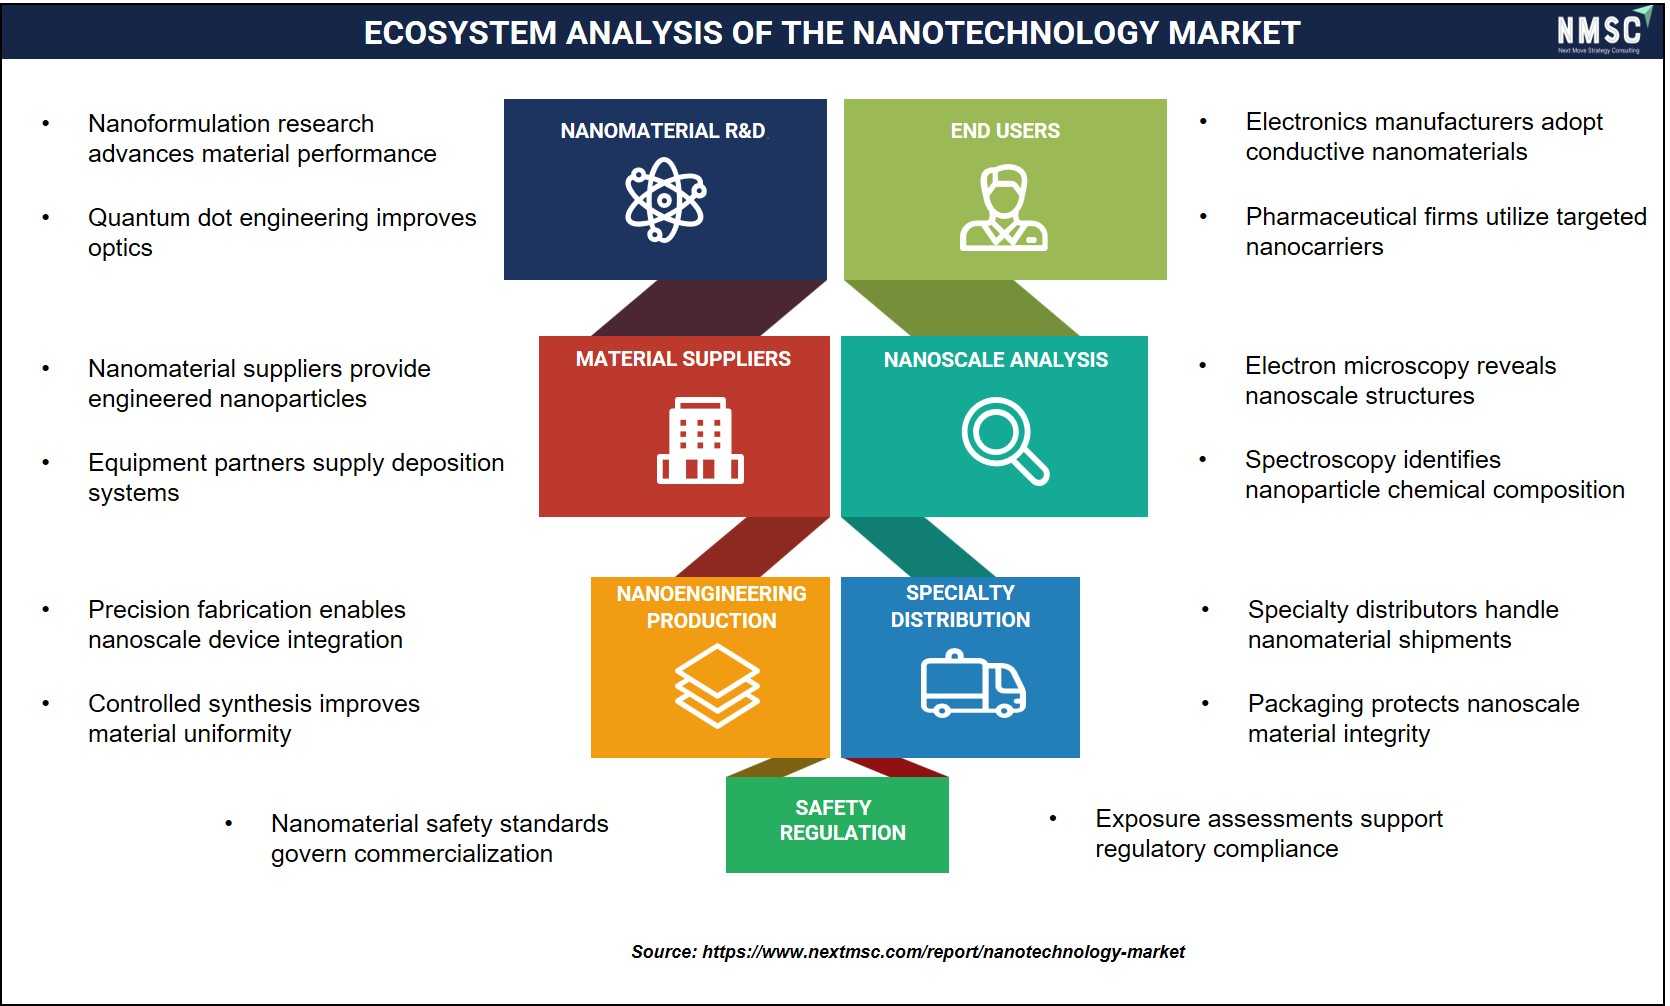
Ecosystem Analysis of the Nanotechnology Industry

The above ecosystem analysis maps the key operational components, such as nanomaterial R&D, material suppliers, nanoengineering, specialty production, nanoscale analysis, distribution, safety regulation, and end users, shaping the nanotechnology Industry. From our analysis, we observed that nanomaterial R&D and material suppliers drive innovation, while nanoengineering and specialty production ensure advanced manufacturing. Nanoscale analysis and distribution support quality and market reach, whereas safety regulation ensures compliance, and end users represent key adopters across the market ecosystem.

Growth Opportunities

We found that three forward-looking whitespace opportunities stand out for stakeholders positioning within the Nanotechnology market over the coming decade.

How Can Producers Capture Demand from Battery Material Scale-Up?

Expanding lithium-ion battery manufacturing capacity creates a mechanism for carbon nanomaterial producers to secure long-term supply agreements with battery cell manufacturers. Producers with commercial-scale, energy-efficient graphene nanotube capacity stand to benefit most, as battery makers increasingly specify nanotube-enhanced conductive additives to improve energy density and cycle life.

What Opportunity Does Nanomedicine Combination Therapy Present for Developers?

Advancing radiotherapy-activated nanoparticle combination therapeutics creates a mechanism for nanomedicine developers to secure pharmaceutical partnership and licensing agreements. Developers with validated Phase 1 combination safety data stand to benefit most, capturing partnership interest from large pharmaceutical companies seeking novel combination approaches for treatment-resistant solid tumors.
How Can Instrumentation Vendors Unlock Quality Control Contracts in Emerging Markets?

Expanding nanomaterial manufacturing capacity across Asia-Pacific creates a mechanism for characterization instrumentation vendors to secure quality control equipment contracts with new production facilities. Vendors offering integrated microscopy and surface-area characterization platforms stand to benefit most, capturing demand as regional manufacturers scale production while meeting export-market quality certification requirements.

Regional Outlook

2025 (USD Billion)
2035 (USD Billion)
North Americ
Europe
Asia-Pacific
Middle East
Latin Americ
Region 2025 (USD Billion) 2035 (USD Billion) CAGR (%)
North America $10.0 USD Billion $40.0 USD Billion 9.0%
Europe $17.1 USD Billion $51.1 USD Billion 27.0%
Asia-Pacific $24.2 USD Billion $62.2 USD Billion 25.0%
Middle East & Africa $31.3 USD Billion $73.3 USD Billion 23.0%
Latin America $38.4 USD Billion $84.4 USD Billion 12.0%

Regional data is locked

Unlock complete regional numbers for this market.

Unlock Full Data

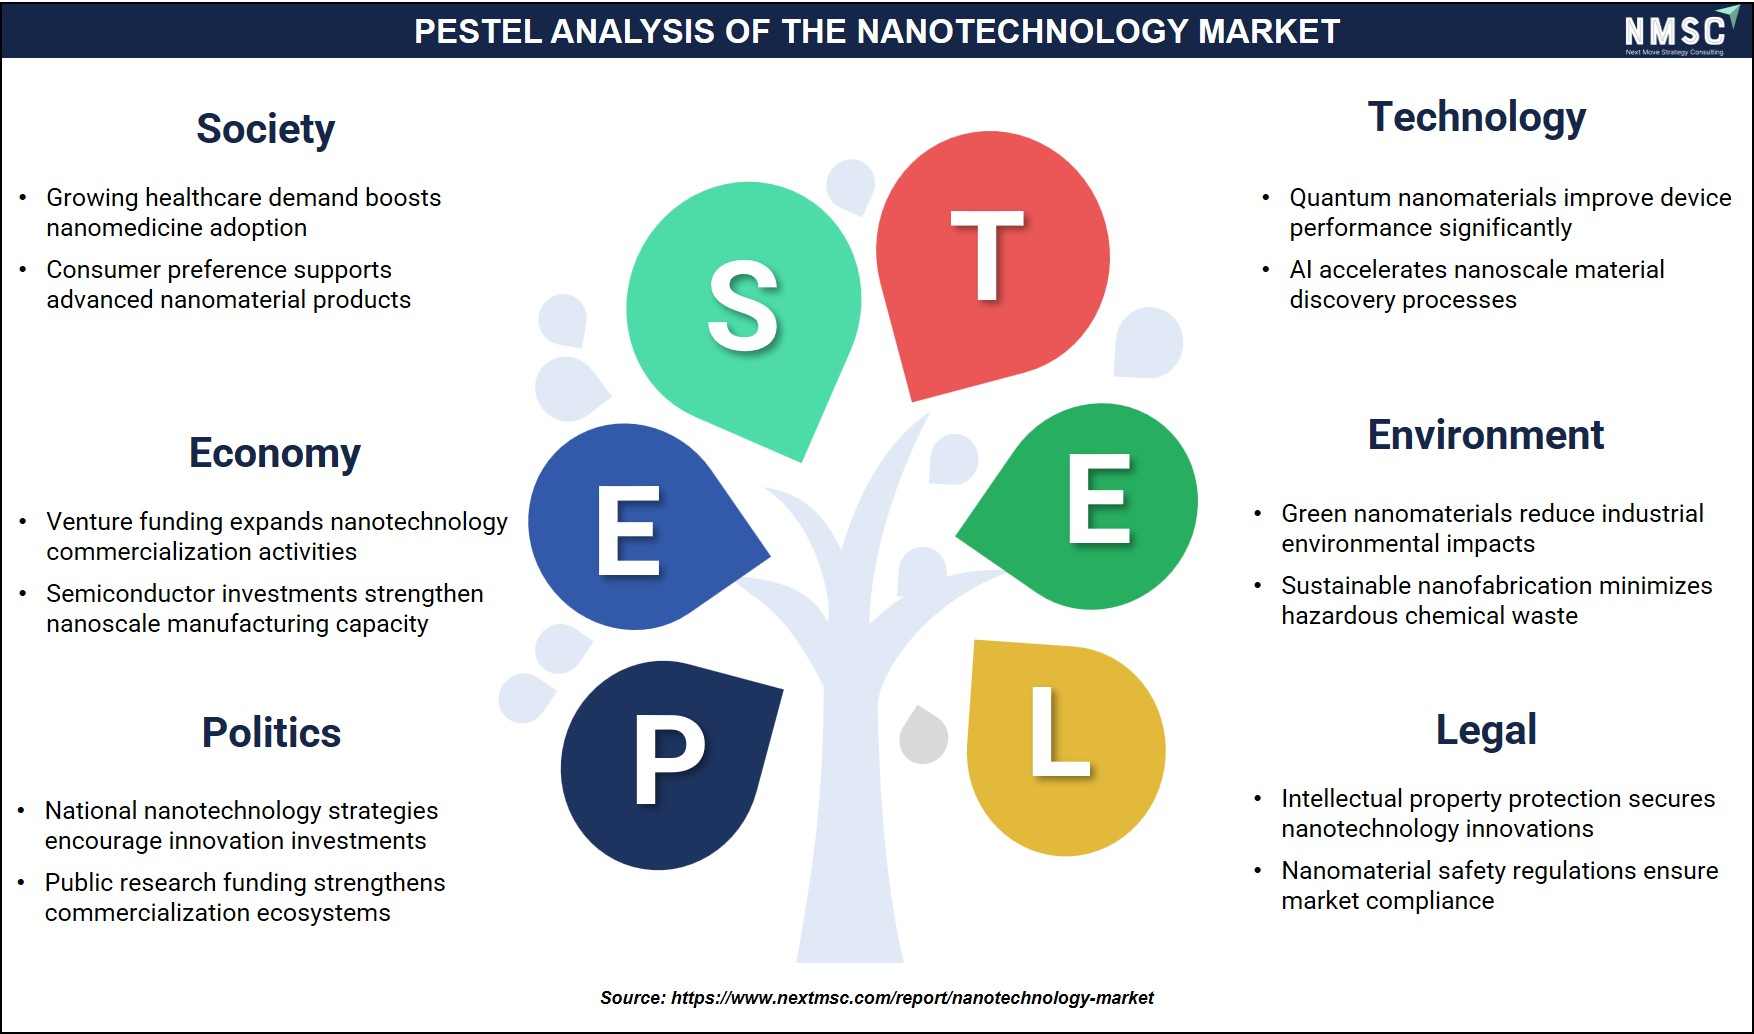
PESTEL Analysis of the Nanotechnology Industry

PESTEL Analysis of the Nanotechnology Industry

The above PESTEL analysis maps the key macro-environmental factors, such as political, economic, social, technological, environmental, and legal, shaping the Nanotechnology Market. From our analysis, we observed that political stability and government funding support research and innovation, while economic factors influence investment and commercialization costs. Social acceptance and technological advancements drive innovation, whereas environmental regulations promote sustainable nanomaterial applications. Legal frameworks, including safety standards and compliance requirements, ensure responsible development and consumer protection, reflecting a comprehensive PESTEL landscape across the nanotechnology Industry.

Competitive Landscape

We observed that the Nanotechnology Industry features a moderately fragmented competitive landscape, with diversified specialty chemical and instrumentation groups competing alongside focused nanomaterial and nanomedicine developers on production scale, clinical validation, and characterization technology depth. Key Takeaways

Dimension Description
Market Structure Moderately fragmented; leading diversified specialty chemical and instrumentation groups profiled in this report collectively account for a significant share of branded nanotechnology revenue, while focused nanomaterial and nanomedicine developers serve specialized product categories.
Innovation Focus Commercial-scale carbon nanomaterial manufacturing, clinical-stage nanomedicine combination therapeutics, and advanced characterization instrumentation dominate current innovation pipelines across leading producers.
Strategic Investment and Partnership Activity Selective capacity investment and licensing partnerships, exemplified by OCSiAl's planned Luxembourg graphene nanotube facility and Nanobiotix's continued Johnson & Johnson-sponsored clinical development partnership.

How Do Companies Compete in the Nanotechnology Industry?

Companies compete primarily on production scale, clinical or technical validation depth, and characterization technology capability across the industry. Diversified specialty chemical groups such as BASF SE and Evonik Industries leverage broad materials portfolios and formulation expertise to serve multiple end-use industries, while focused developers such as OCSiAl Group and Nanobiotix S.A. compete on deep technical specialization within carbon nanomaterials and clinical-stage nanomedicine, respectively.

Which Competitive Archetypes Dominate the Nanotechnology Industry?

Two archetypes dominate the Industry, which are diversified specialty chemical and instrumentation groups offering integrated materials and characterization portfolios, and focused nanomaterial or nanomedicine developers building deep technical expertise in a single product category. BASF SE and Thermo Fisher Scientific exemplify the diversified archetype through broad materials and instrumentation portfolios, while OCSiAl Group and Nanobiotix S.A. exemplify the focused developer archetype concentrated on carbon nanomaterials and radiotherapy-activated nanomedicine.

How Are Companies Differentiating Through Innovation in Nanotechnology?

Innovation and differentiation strategy increasingly center on commercial-scale manufacturing capability and clinical validation depth. OCSiAl's planned Luxembourg production hub and Nanobiotix's advancing Phase 1 combination trial data both reflect efforts to secure differentiated positioning through demonstrated scale-up and clinical progress rather than laboratory-stage claims. Our analysis shows that developers unable to demonstrate commercial-scale production or clinical validation risk losing partnership and investment interest to more advanced competitors.

What M&A and Expansion Activity Is Shaping the Nanotechnology Industry?

Capacity investment and licensing partnerships continue to reshape competitive positioning within the industry. OCSiAl's USD 300 million Luxembourg facility investment and Nanobiotix's continued Johnson & Johnson-sponsored Phase 3 trial illustrate how established developers pursue capacity expansion and pharmaceutical partnership deepening rather than large-scale acquisitions to advance market position.

Key Market Players

Our assessment indicates that the following 20 companies are actively shaping production capacity, clinical development, and characterization technology innovation within the Nanotechnology Industry.

Thermo Fisher Scientific Inc. Carl Zeiss AG Hitachi High-Tech Corporation JEOL Ltd. Bruker Corporation Oxford Instruments plc Park Systems Corp. OCSiAl Group NanoXplore Inc. DuPont de Nemours, Inc. LG Chem, Ltd. Evonik Industries AG Wacker Chemie AG Cabot Corporation Arkema S.A. Resonac Holdings Corporation BASF SE Nanoco Group plc Solésence, Inc. Nanobiotix S.A.

Latest Developments

We found that recent capacity investments and clinical progress within the nanotechnology supply chain are concentrated on carbon nanomaterial manufacturing expansion and nanomedicine combination therapy validation.

Date Event
April 2026 Park Systems completed its acquisition of U.S.-based Rocky Mountain Nanotechnology, securing solid-metal AFM probe manufacturing. The company plans a dedicated probe production facility in South Korea through technology transfer from RMN’s Utah operations.
November 2025 OCSiAl launched development of a USD 300 million graphene nanotube manufacturing facility in Differdange, Luxembourg. The project will create over 300 jobs and operate in stages from 2028 to 2030.

Expert Insights

M.R. Jayaram

Chancellor | Ramaiah University of Applied Sciences

"The future of education will necessarily entail integrating human intelligence, artificial intelligence and technology in the generation of knowledge. We must prepare ourselves for the brave new world of nanotechnology, robotics, and artificial intelligence, but one in which we build an abiding sense of ethical conduct and purposive action for the greater good"

Analyst Interpretation

The statement highlights the expanding role of nanotechnology within the broader advanced-technology ecosystem, particularly alongside semiconductors, artificial intelligence, and robotics. NMSC's analysis indicates that continued development of nanotechnology increasingly depends on specialized skills, research capabilities, and advanced manufacturing infrastructure. The growing integration of nanoscale technologies with semiconductor processing and other emerging technologies is creating opportunities for innovation across electronics, sensors, advanced materials, healthcare, and other high-technology applications.

The statement highlights the expanding role of nanotechnology within the broader advanced-technology ecosystem, particularly alongside semiconductors, artificial intelligence, and robotics. NMSC's analysis indicates that continued development of nanotechnology increasingly depends on specialized skills, research capabilities, and advanced manufacturing infrastructure. The growing integration of nanoscale technologies with semiconductor processing and other emerging technologies is creating opportunities for innovation across electronics, sensors, advanced materials, healthcare, and other high-technology applications.

Investment Opportunities

What Capital Inflows Are Supporting the Nanotechnology Industry?

Nanomaterial producers and nanomedicine developers are directing capital toward commercial-scale manufacturing and clinical development capability. OCSiAl's USD 300 million Luxembourg facility investment and Nanobiotix's continued Johnson & Johnson-sponsored clinical partnership illustrate sustained capital and resource commitments supporting nanotechnology capacity and pipeline expansion across the value chain.

How Is Infrastructure Investment Shaping Nanotechnology Demand?

Government and private research infrastructure investment continues to expand the addressable base for nanomaterial and instrumentation demand. Our assessment indicates that sustained semiconductor and battery manufacturing capacity investment across Asia-Pacific is creating multi-year procurement pipelines for nanomaterial suppliers and characterization instrumentation vendors serving these expanding production facilities.

What ESG Considerations Are Influencing Nanotechnology Investment Decisions?

Environmental, social, and governance considerations are increasingly influencing capital allocation toward sustainably powered nanomaterial manufacturing and safety-characterized product development. OCSiAl's hydroelectric-powered Serbian facility and planned energy-efficient Luxembourg hub reflect this shift toward lower-carbon manufacturing. We observed that investors are favoring producers with documented sustainability and safety characterization credentials as environmentally linked procurement criteria gain traction across the nanotechnology value chain.

Key Benefits for Stakeholders

How Does This Report Benefit Industry Leaders and Materials Scientists?

Industry leaders and materials scientists gain granular segmentation data across offering, end use, and regional axes, enabling informed technology investment decisions for new nanomaterial and nano-enabled product development. Our analysis, data, and forecasts help materials teams benchmark development strategy against verified 2025–2035 market trajectories and evolving regulatory characterization trends.

How Does This Report Benefit Investors and Financial Analysts?

Investors and financial analysts gain a validated 2025 base-year market size, a fundamentals-supported 2026–2035 CAGR, and segment-level growth trajectories that support capital allocation and competitive benchmarking decisions. The report's strategic insights into producer capacity expansion and clinical pipeline progress help analysts assess relative positioning across the nanotechnology value chain.

How Does This Report Benefit Technology Vendors and Product Teams?

Technology vendors and product teams gain visibility into the fastest-growing sub-segments, including Nano-enabled Finished Products and Healthcare and Life Sciences end use, informing product roadmap and go-to-market prioritization aligned with documented buyer and application demand shifts through 2035.

Key Market Segments Evaluated

By Offering

  • Nanomaterials 
    • Carbon Materials
      • Carbon Nanotubes
      • Graphene
      • Fullerenes
      • Carbon Fibers
      • Other Carbon Materials
    • Inorganic Nanomaterials
      • Metal Nanoparticles
      • Metal Oxide Nanoparticles
      • Semiconductor Nanoparticles
      • Other Inorganic Nanomaterials
    • Silica and Silicates
      • Fumed Silica
      • Nano Silica
      • Nanoclays
      • Other Silica and Silicates
    • Polymer and Bio Nanomaterials
      • Dendrimers
      • Micelles
      • Lipid Nanoparticles
      • Other Polymer and Bio Nanomaterials
    • Hybrid and Other Nanomaterials
  • Formulated Materials 
    • Nanocomposites
      • Polymer Matrix
      • Metal Matrix
      • Ceramic Matrix
    • Nanocoatings
      • Barrier Coatings
      • Conductive Coatings
      • Protective Coatings
      • Functional Coatings
    • Nanoinks and Nanopastes
      • Conductive Inks
      • Dielectric Inks
      • Quantum Dot Inks
      • Other Nanoinks and Nanopastes
    • Nanofilms and Membranes
      • Barrier Films
      • Filtration Membranes
      • Optical Films
      • Other Nanofilms and Membranes
    • Other Formulated Materials
  • Nano-enabled Components 
    • Nanoelectronics
      • Transistors
      • Memories
      • Logic Devices
      • NEMS
      • Other Nanoelectronics
    • Nanosensors
      • Chemical Nanosensors
      • Biological Nanosensors
      • Physical Nanosensors
      • Imaging Nanosensors
      • Other Nanosensors
    • Nanophotonics
      • Displays
      • Optoelectronics
      • Optical Components
      • Other Nanophotonics
    • Nanoenergy Components
      • Battery Components
      • Supercapacitor Components
      • Fuel Cell Components
      • Solar Cell Components
      • Other Nanoenergy Components
    • Other Nano-enabled Components
  • Nano-enabled Finished Products 
    • Nanomedical Products
      • Drug Delivery Products
      • Diagnostic Products
      • Therapeutic Products
      • Imaging Products
      • Other Nanomedical Products
    • Nano-enabled Energy Products
      • Solar Products
      • Battery Products
      • Other Nano-enabled Energy Products
    • Nano-enabled Display Products
    • Other Nano-enabled Finished Products
  • Nanotools and Instruments 
    • Microscopy and Imaging
      • AFM
      • SEM
      • TEM
      • STM
      • X-Ray Nano CT
    • Characterization Instruments
      • DLS and Zeta Potential
      • NTA
      • BET Surface Area
      • Single Particle ICP-MS
      • Other Characterization Instruments
    • Lithography and Patterning
      • E-Beam Lithography
      • Nanoimprint Lithography
      • FIB Systems
      • Dip Pen Lithography
      • Other Lithography and Patterning
    • Manipulation and Assembly
      • Nanomanipulators
      • Nanoindenters
      • Probe Stations
      • Other Manipulation and Assembly
    • Process Control Systems
      • Deposition Equipment
      • Etching Equipment
      • Inspection Systems
      • Metrology Systems
      • Other Process Control Systems
  • Nano Services 
    • Contract Research and Development
    • Testing and Certification
    • Scale-up and Manufacturing
    • Licensing and Consulting
    • Other Nano Services

By Technology

  • Top-down Techniques 
    • Lithography
    • Etching
    • Deposition
    • Other Top-down Techniques
  • Bottom-up Techniques 
    • Self-assembly
    • Sol-gel Processing
    • Electrospinning
    • Chemical Vapor Synthesis
    • Other Bottom-up Techniques

By End Use

  • Electronics and IT
  • Healthcare and Life Sciences
  • Energy and Utilities
  • Automotive
  • Aerospace and Defense
  • Construction and Infrastructure
  • Textiles
  • Personal Care
  • Food and Beverage
  • Environmental and Water Treatment
  • Other End Uses

By Buyer Type

  • OEM
  • Foundry
  • Research Institute
  • Industrial End User
  • Healthcare Provider
  • Government
  • Other Buyer Types

By Distribution Channel

  • Direct Sales
  • Distributor
  • E-Commerce
  • Project-Based
  • Other Channels

By Region

  • North America 
    • U.S.
    • Canada
    • Mexico
  • Europe 
    • UK
    • Germany
    • France
    • Italy
    • Spain
    • Sweden
    • Denmark
    • Finland
    • Netherlands
    • Rest of Europe
  • Asia-Pacific 
    • China
    • India
    • Japan
    • South Korea
    • Taiwan
    • Indonesia
    • Vietnam
    • Australia
    • Philippines
    • Malaysia
    • Rest of APAC
  • Middle East & Africa 
    • Saudi Arabia
    • UAE
    • Egypt
    • Israel
    • Turkey
    • Nigeria
    • South Africa
    • Rest of MEA
  • Latin America 
    • Brazil
    • Argentina
    • Chile
    • Colombia
    • Rest of LATAM

Conclusion & Recommendations

The Nanotechnology Industry is positioned for sustained growth through 2035, underpinned by expanding carbon nanomaterial manufacturing capacity and advancing nanomedicine clinical pipelines. We expect Nano-enabled Finished Products and Healthcare and Life Sciences demand to gain structural share as clinical-stage products mature, while Nanomaterials and Electronics and IT retain their position as significant revenue contributors across the forecast period.

What Strategic Positioning Should Manufacturers Pursue?

Producers should prioritize commercial-scale manufacturing capability and clinical or technical validation depth to align with buyer procurement priorities. Our assessment indicates that producers investing in large-scale, sustainably powered production, following the pattern established by OCSiAl's Luxembourg facility, are best positioned to capture battery material and healthcare application opportunities through 2035.

How Attractive Is the Nanotechnology Industry for Investment?

The market presents an attractive investment case, supported by a validated USD 233.35 Billion absolute dollar opportunity between 2026 and 2035 and a fundamentals-backed 12.6% CAGR. Sustained capacity and clinical development investment, as demonstrated by OCSiAl's USD 300 million Luxembourg commitment and Nanobiotix's continued pharmaceutical partnership progress, signals sustained investor confidence in the segment's growth trajectory.

What Market Shifts and Key Risks Should Stakeholders Monitor?

Stakeholders should monitor regulatory uncertainty around nanomaterial safety characterization, which restrains commercialization timelines across multiple jurisdictions. We found that high capital costs for commercial-scale nanomaterial production also pose a risk to near-term capacity expansion, particularly for smaller developers with limited access to large-scale project financing.

What Are the Key Growth Pathways Through 2035?

Key growth pathways include expanding carbon nanomaterial supply for battery and composite applications, scaling clinical-stage nanomedicine combination therapeutics toward commercial approval, and deepening characterization instrumentation demand tied to semiconductor and battery quality control. Our findings suggest that producers combining manufacturing scale with validated technical or clinical performance are best positioned to capture a disproportionate share of the market's projected USD 355.54 Billion 2035 revenue base.

FAQs

About the Author

Mayurima Roy

Mayurima Roy

Mayurima Roy is Research Analyst at Next Move Strategy Consulting, where she has spent 4 years working across the firm's full industry coverage rather than a single fixed vertical. Her work centers on structured research, ongoing trend tracking, competitive assessment, and insight-led content development, translating complex market data into clear, decision-ready narratives that support informed client decision-making across diverse global industries, market sectors, and world regions every day.

About the Reviewer

Supradip Baul

Supradip Baul

Supradip Baul is an accomplished business consultant and strategist with over a decade of rich experience in market intelligence, strategy, technology, and business transformation. His work has included rigorous qualitative and quantitative analysis across multiple industries, helping clients shape investment decisions and long-term roadmaps. Earlier in his career, he was associated with Gartner, where he contributed to industry-leading reports and market share analyses. He has worked with leading global companies and holds an MBA with a dual specialization in Marketing and Finance.

Download Free Sample

Kevin Coker

KEVIN COKER

Founder, CEO and Board Diector

Proxima Clinical Research

I have been using Next MSC reports for product positioning in a new geography for a long time. They have by far the best reports I have found and the price is reasonable too!

Diana Trejo

DIANA TREJO

Assistant Manager

Sumitomo Corporation de Mexico, S.A. de C.V.

Recently, we purchased a report on the Mexico Data Center Market from Next Move Strategy Consulting. The service has been excellent, with support that is always timely and thoroughly professional. The information provided is interesting, highly useful, and delivered with clarity. I would highly recommend NextMSC for anyone seeking insightful and dependable analysis.

Pratyush Kumar Das

PRATYUSH KUMAR DAS

Assistant Manager

Polycab India Limited

We would like to express our appreciation for the data and insights provided by nextmsc. We are very pleased with the quality and depth of the information, which has proven to be highly valuable and beneficial for our business decision-making.

Kishu Kanda

KISHU KANDA

Strategy Analyst

Accenture

We purchased the AI Consumer Market Report from this company. Not only did they customize the report to meet our specific requirements, but they also showed great flexibility in accommodating our budget. The report we received fully met our expectations. Additionally, they provided prompt and thorough responses to both our pre-purchase and follow-up questions. We look forward to working with this company again in the future.

Semih Kavaklioglu

SEMIH KAVAKLIOGLU

Co-Founder & Sales Manager

Decortie

I work a lot in the marketing industry and I know that research is an essential part of any campaign. I have used Market research reports for my own products and I found them to be very informative and well-researched. The team here produces insightful reports for a good price

Custom Market Research Services

We will customize the research for you if the listed report does not fully match your requirements.

Get 30% Free Customization

Select License

This website uses cookies to ensure you get the best experience on our website. Learn more

✖