Power Generation Market Global Industry Analysis and Forecast (2026–2035)

Power Generation Market size was USD 2,434.33 Billion in 2025, projected to reach USD 5,357.66 Billion by 2035, growing at a CAGR of 7.79% from 2026 to 2035. Key drivers include accelerating global electricity demand growth driven by transport and industrial electrification, rapid solar and wind cost deflation, and energy security policies reshaping generation capacity mix across 38 countries, with Asia-Pacific leading market expansion.

Download Free Sample PDF
Base Year (2025)
$2,434.33 Billion
Forecast (2035)
$5,357.66 Billion
CAGR (2026-2035)
7.8%
Top Country
Asia-Pacific

What Is the Power Generation Market Size?
The global Power Generation Market size reached USD 2,434.33 Billion in 2025 and is estimated at USD 2,726.67 Billion in 2026, forecast to reach USD 5,357.66 Billion by 2035, growing at a CAGR of 7.79% from 2026 to 2035. Asia-Pacific leads with approximately 45% revenue share, while Thermal Generation dominates the technology segment at approximately 38% share in 2025. Accelerating renewable energy deployment and grid modernization investment are the principal structural catalysts sustaining this growth trajectory.
We observed that the market's structural transformation from fossil-fuel-centric baseload to diversified, technology-integrated generation portfolios is simultaneously elevating total addressable revenue while compressing per-unit generation margins across thermal categories.

Power Generation Market Global Industry Analysis and Forecast (2026–2035) Revenue Forecast

Values in USD Billion

2025 $2,434.33 Billion
2025
2026 $2,726.67 Billion
2026
2027 $2,939.08 Billion
2027
2028 $3,168.03 Billion
2028
2029 $3,414.82 Billion
2029
2030 $3,680.84 Billion
2030
2031 $3,967.57 Billion
2031
2032 $4,276.65 Billion
2032
2033 $4,609.80 Billion
2033
2034 $4,968.90 Billion
2034
2035 $5,357.66 Billion
2035

Key Takeaways

By Generation Technology: Thermal Generation held the largest share, expanding from USD 924.95 Billion in 2025 to USD 1,497.94 Billion by 2035; Solar Generation is the fastest-growing sub-segment at 15.07% CAGR from 2026–2035.

By Operating Mode: Power-only Generation held the largest share, expanding from USD 1,995.95 Billion in 2025 to USD 4,220.10 Billion by 2035; Combined Heat and Power is the fastest-growing sub-segment at 9.78% CAGR from 2026–2035.

By Grid Connection: Grid-connected generation held the largest share, expanding from USD 1,898.78 Billion in 2025 to USD 3,857.52 Billion by 2035; Off-grid is the fastest-growing sub-segment at 11.82% CAGR from 2026–2035.

Dominant Region: Asia-Pacific dominated with approximately 45% revenue share in 2025.

Fastest-Growing Region: Middle East & Africa is expected to register the highest CAGR of 8.95% during 2026–2035.

Dominant Country: China led the market, anchored by the world’s largest installed generation capacity base exceeding 3,400 GW.

Fastest-Growing Country: India is the fastest-growing country, supported by the National Electricity Plan’s 500 GW renewable target and rapid capacity additions across solar and wind.

The Power Generation Market presents an absolute investment opportunity of approximately USD 2,630.99 Billion between 2026 and 2035, calculated as the difference between the 2035 forecast of USD 5,357.66 Billion and the 2026 base of USD 2,726.67 Billion, positioning solar generation, offshore wind, and advanced nuclear as high-conviction categories for infrastructure investors and strategic generation asset developers.

According to NMSC analysis, the convergence of electrification-driven demand growth, solar and wind cost deflation, and state-level energy security mandates is structurally repositioning the Power Generation Market from a fossil-fuel-anchored baseload model toward a diversified, digitally managed, multi-technology portfolio, with Asia-Pacific generating the largest share of new installed capacity additions globally through 2035.

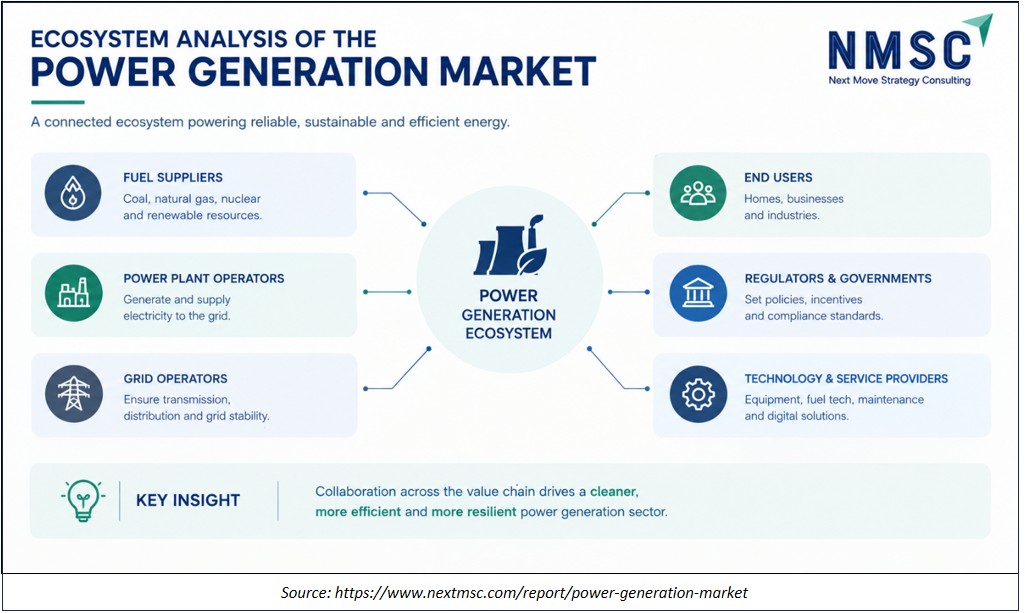
Ecosystem Analysis of the Power Generation Industry

The above infographic provides a detailed ecosystem analysis of the power generation market, mapping out six key components from fuel suppliers and plant operators to end users and regulators. It illustrates how grid operators and technology providers interact within a connected network to ensure reliable transmission and efficient energy supply. The analysis further highlights the critical role of government policies and compliance standards in shaping the industry. Ultimately, the key insight emphasizes that collaboration across the value chain is essential for driving a cleaner, more efficient, and resilient power generation sector .

What Does the Power Generation Market Encompass?

The Power Generation Market encompasses all commercial electricity generation activities spanning thermal, nuclear, hydro, wind, solar, bioenergy, geothermal, marine, and fuel cell technologies delivered to grid-connected, behind-the-meter, and off-grid end points through wholesale and retail sales channels. Market scope includes power-only generation and combined heat and power installations owned and operated by public utilities, independent power producers, state-owned enterprises, and distributed energy resource operators serving residential, commercial, industrial, and public-sector consumers across 38 covered countries.
The market has evolved structurally from vertically integrated, centrally planned utility operations toward liberalized competitive frameworks in which independent power producers, corporate power purchase agreements, and direct consumer generation coexist with residual regulated utility structures. Regulatory drivers including the EU Fit for 55 package , the U.S. Inflation Reduction Act, and India’s National Electricity Plan are reshaping capacity mix and investment allocation at the sovereign level, accelerating adoption of variable renewable energy while advancing coal retirement schedules across major economies.

Market Drivers & Dynamics

Interactive Dataset
Global electricity demand growth driven by electrification of transport, industry, and data centers driver +2.8% Global 2026–2035
Accelerating renewable energy deployment and solar/wind cost reduction driver +2.1% Asia-Pacific, Europe 2026–2033
Grid modernization and electricity transmission infrastructure investment driver +1.5% North America, Asia-Pacific 2026–2032
Energy security policies driving domestic generation capacity expansion driver +1.1% Global 2026–2035
Nuclear energy renaissance and advanced reactor commercialization driver +0.7% Europe, Asia-Pacific, North America 2026–2033
Regulatory and permitting delays for new generation projects restraint −1.0% Global 2026–2030
High capital costs and financing risk for large-scale generation projects restraint −0.8% MEA, Latin America 2026–2035
Grid integration challenges for variable renewable energy sources restraint −0.6% Global 2026–2031
Fuel supply price volatility affecting thermal generation margins restraint −0.4% Europe, Asia-Pacific 2026–2030
Source: Next Move Strategy Consulting

Growth Drivers

What Is the Primary Growth Driver in the Power Generation Market?

The primary growth driver is accelerating global electricity demand, propelled by the electrification of transportation, industrial heating processes, and data center operations at scale. The U.S. Energy Information Administration’s 2024 Annual Energy Outlook projects meaningful electricity consumption growth through 2035, driven by electric vehicle charging load and hyperscale AI data center buildout, with demand-side growth occurring simultaneously with the retirement of older thermal capacity. Energy storage systems capable of bridging intermittent renewable supply to firm demand are emerging as co-investments essential to capturing this growth opportunity across both utility-scale and distributed market segments.

How Is Grid Modernization Driving Market Growth?

Our analysis shows that electricity transmission infrastructure investment is directly enabling power generation market expansion by removing network bottlenecks that would otherwise constrain renewable deployment and cross-border power trading. The European Commission’s 2025 Action Plan for Grids identified transmission grid buildout as the most critical near-term enabler of renewable integration, with an estimated requirement of EUR 584 billion in grid investment through 2030. Markets where transmission investment tracks alongside capacity additions are achieving materially higher renewable penetration rates than markets where grid investment lags.

Growth Inhibitors

What Is Restraining the Power Generation Market?

We found that regulatory and permitting complexity represents a major operational restraint, extending project lead times and increasing development risk for new generation facilities across major markets. Berkeley Lab reported that more than 2,000 GW of generation and storage capacity remained in U.S. interconnection queues at the end of 2025, illustrating the scale of connection constraints even after the queue volume declined from its 2023 peak. High capital cost requirements for large-scale nuclear and offshore wind projects further increase financing risk in markets where project revenues do not adequately support long-duration financing structures .

What Are the Growth Opportunities?

Can Offshore Wind Expansion in Deep-Water Marine Zones Unlock a New Frontier for Power Generation Revenues?

Floating offshore wind technology is progressing toward commercial viability in water depths exceeding 60 meters, expanding addressable ocean areas well beyond the fixed-bottom zones that currently host all operational offshore wind capacity. We observed that floating offshore wind demonstrations in Norway, Japan, and South Korea are confirming cost reduction trajectories consistent with commercial deployment at scale, benefiting the Wind Generation and Marine Generation segments simultaneously as platform suppliers build manufacturing volume. Developers securing floating wind development rights in the near term are positioning for a first-mover advantage in a technology category where cost reduction curves closely parallel the early trajectory of fixed-bottom offshore wind development.

Does Integrated Utility-Scale Solar with Long-Duration Storage Present Structural Whitespace in Emerging Markets?

Markets across Asia-Pacific, the Middle East & Africa, and Latin America where grid infrastructure remains underdeveloped represent the highest-growth whitespace for integrated solar-plus-storage systems that bypass traditional centralized grid dependencies entirely. Our assessment indicates that Concentrated Solar Power installations with integrated thermal storage offer a firm, dispatchable renewable alternative particularly suited to high-solar-resource arid regions where grid extension economics are unfavorable . Companies deploying integrated solar storage solutions in behind-the-meter and off-grid configurations targeting commercial and industrial consumers in these geographies are positioned to capture disproportionate value from the Off-grid segment’s forecast 11.82% CAGR through 2035.

Can Advanced Nuclear and Long-Duration Storage Capture the Baseload Flexibility Gap Left by Coal Retirement?

Coal retirement schedules across Europe, North America, and progressively across Asia-Pacific are creating an accelerating baseload flexibility gap that neither solar nor wind alone can address without co-investment in firm, weather-independent capacity. Our analysis shows that advanced nuclear reactor designs including small modular reactors targeting outputs of 50 to 300 MW, and long-duration energy storage technologies, are the candidate technology categories most structurally positioned to address this gap, benefiting the Nuclear Generation and Fuel Cell Generation segments as regulatory approval timelines compress. Developers and utilities that integrate firm renewable alternatives into resource plans now will materially outperform those planning sequential transitions through 2035.

Segmentation Analysis

2025 (USD Billion)
2035 (USD Billion)
Thermal Gene
Coal Generat
Anthracite a
Sub-bitumino
Lignite
Segment Item 2025 (USD Billion) 2035 (USD Billion) CAGR
Thermal Generation $10.0 USD Billion $40.0 USD Billion 14.0%
Coal Generation $17.1 USD Billion $51.1 USD Billion 8.0%
Anthracite and Bituminous Coal $24.2 USD Billion $62.2 USD Billion 14.0%
Sub-bituminous Coal $31.3 USD Billion $73.3 USD Billion 20.0%
Lignite $38.4 USD Billion $84.4 USD Billion 27.0%

Segment-wise data is locked

Unlock complete segment-wise numbers for By Generation Technology.

Unlock Full Data

Which Generation Technology Segment Dominates and Which Grows Fastest?

Thermal Generation leads with USD 924.95 Billion in 2025, expanding to USD 1,497.94 Billion by 2035, reflecting the continued centrality of coal and natural gas , particularly combined cycle gas turbine plants , to baseload electricity supply across Asia-Pacific and developing economies. Solar Generation is the fastest-growing technology segment at a 15.07% CAGR from 2026 to 2035, driven by levelized cost reductions that have made utility-scale photovoltaic the lowest-cost source of new electricity in most major markets, creating investment momentum that continues to accelerate independently of subsidy support in advanced economies.

2025 (USD Billion)
2035 (USD Billion)
Power-only G
Combined Hea
Segment Item 2025 (USD Billion) 2035 (USD Billion) CAGR
Power-only Generation $10.0 USD Billion $40.0 USD Billion 25.0%
Combined Heat and Power $17.1 USD Billion $51.1 USD Billion 11.0%

Segment-wise data is locked

Unlock complete segment-wise numbers for By Operating Mode.

Unlock Full Data

Which Operating Mode Leads and Which Grows Fastest?

Power-only Generation dominates at USD 1,995.95 Billion in 2025, reflecting its structural primacy in utility-scale electricity markets where generation and heat supply remain operationally separated across the majority of installed capacity globally. Combined Heat and Power is the fastest-growing operating mode at a 9.78% CAGR from 2026 to 2035, as industrial energy efficiency mandates in Europe and Asia-Pacific increasingly favor co-generation installations that capture waste heat alongside electricity output, materially improving total system efficiency relative to separate heat and power generation configurations.

2025 (USD Billion)
2035 (USD Billion)
Grid-connect
Behind-the-m
Off-grid
Segment Item 2025 (USD Billion) 2035 (USD Billion) CAGR
Grid-connected $10.0 USD Billion $40.0 USD Billion 27.0%
Behind-the-meter $17.1 USD Billion $51.1 USD Billion 9.0%
Off-grid $24.2 USD Billion $62.2 USD Billion 19.0%

Segment-wise data is locked

Unlock complete segment-wise numbers for By Grid Connection.

Unlock Full Data

Which Grid Connection Type Leads and Which Grows Fastest?

Grid-connected generation dominates at USD 1,898.78 Billion in 2025, reflecting the continued primacy of centralized transmission networks as the primary delivery mechanism for utility-scale power. Off-grid generation is the fastest-growing connection type at an 11.82% CAGR from 2026 to 2035, driven by the accelerating commercial viability of off-grid solar power systems combined with battery storage in rural and remote markets across Asia-Pacific, the Middle East & Africa, and Latin America , where grid extension economics remain unfavorable . Behind-the-meter generation at a 9.40% CAGR reflects corporate and industrial demand for self-generation as a hedge against retail electricity price volatility and grid reliability risk.

2025 (USD Billion)
2035 (USD Billion)
Wholesale Ma
Utility Buye
Retailer Buy
Trader
Aggregator
Segment Item 2025 (USD Billion) 2035 (USD Billion) CAGR
Wholesale Market $10.0 USD Billion $40.0 USD Billion 14.0%
Utility Buyer $17.1 USD Billion $51.1 USD Billion 24.0%
Retailer Buyer $24.2 USD Billion $62.2 USD Billion 22.0%
Trader $31.3 USD Billion $73.3 USD Billion 12.0%
Aggregator $38.4 USD Billion $84.4 USD Billion 27.0%

Segment-wise data is locked

Unlock complete segment-wise numbers for By Sales Channel.

Unlock Full Data

Growth Opportunities

Our analysis shows that three whitespace opportunities stand out for generation developers, technology vendors, and infrastructure investors positioning ahead of 2035 demand.

Can Offshore Wind Expansion in Deep-Water Marine Zones Unlock a New Frontier for Power Generation Revenues?

Floating offshore wind technology is progressing toward commercial viability in water depths exceeding 60 meters, expanding addressable ocean areas well beyond the fixed-bottom zones that currently host all operational offshore wind capacity. We observed that floating offshore wind demonstrations in Norway, Japan, and South Korea are confirming cost reduction trajectories consistent with commercial deployment at scale, benefiting the Wind Generation and Marine Generation segments simultaneously as platform suppliers build manufacturing volume. Developers securing floating wind development rights in the near term are positioning for a first-mover advantage in a technology category where cost reduction curves closely parallel the early trajectory of fixed-bottom offshore wind development.

Does Integrated Utility-Scale Solar with Long-Duration Storage Present Structural Whitespace in Emerging Markets?

Markets across Asia-Pacific, the Middle East & Africa, and Latin America where grid infrastructure remains underdeveloped represent the highest-growth whitespace for integrated solar-plus-storage systems that bypass traditional centralized grid dependencies entirely. Our assessment indicates that Concentrated Solar Power installations with integrated thermal storage offer a firm, dispatchable renewable alternative particularly suited to high-solar-resource arid regions where grid extension economics are unfavorable . Companies deploying integrated solar storage solutions in behind-the-meter and off-grid configurations targeting commercial and industrial consumers in these geographies are positioned to capture disproportionate value from the Off-grid segment’s forecast 11.82% CAGR through 2035.

Can Advanced Nuclear and Long-Duration Storage Capture the Baseload Flexibility Gap Left by Coal Retirement?

Coal retirement schedules across Europe, North America, and progressively across Asia-Pacific are creating an accelerating baseload flexibility gap that neither solar nor wind alone can address without co-investment in firm, weather-independent capacity. Our analysis shows that advanced nuclear reactor designs including small modular reactors targeting outputs of 50 to 300 MW, and long-duration energy storage technologies, are the candidate technology categories most structurally positioned to address this gap, benefiting the Nuclear Generation and Fuel Cell Generation segments as regulatory approval timelines compress. Developers and utilities that integrate firm renewable alternatives into resource plans now will materially outperform those planning sequential transitions through 2035.

Regional Outlook

2025 (USD Billion)
2035 (USD Billion)
North Americ
Europe
Asia-Pacific
Middle East
Latin Americ
Region 2025 (USD Billion) 2035 (USD Billion) CAGR (%)
North America $10.0 USD Billion $40.0 USD Billion 9.0%
Europe $17.1 USD Billion $51.1 USD Billion 27.0%
Asia-Pacific $24.2 USD Billion $62.2 USD Billion 25.0%
Middle East & Africa $31.3 USD Billion $73.3 USD Billion 23.0%
Latin America $38.4 USD Billion $84.4 USD Billion 12.0%

Regional data is locked

Unlock complete regional numbers for this market.

Unlock Full Data

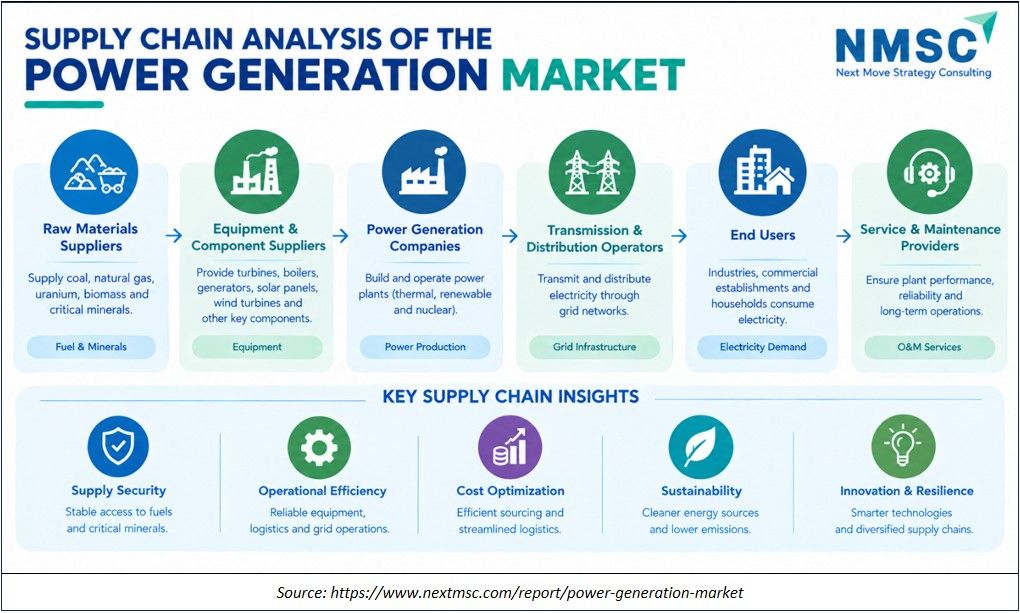
Supply Chain Analysis of the Power Generation Industry

Supply Chain Analysis of the Power Generation Industry
The above infographic provides a detailed supply chain analysis of the power generation market, outlining a six-step flow from raw material suppliers to service providers. It traces the process from sourcing fuels and equipment through power production, grid transmission, and final consumption by end users. The analysis further highlights key supply chain insights, emphasizing supply security, operational efficiency, and cost optimization as critical drivers. Ultimately, it demonstrates how this interconnected chain supports sustainability and innovation while ensuring reliable, long-term energy operations .

Competitive Landscape

Our assessment indicates that the Power Generation Market is shaped by state-owned generation giants, diversified utility conglomerates, and independent renewable developers, each competing on installed capacity scale, fuel and technology diversification, cost of capital, and depth of direct bilateral customer relationships with large industrial and commercial power buyers.

Dimension Description
Dimension Assessment
Market Structure Moderately concentrated at large-scale thermal and hydro generation; highly fragmented at distributed and behind-the-meter segments; state-owned enterprises in Asia-Pacific control disproportionate installed capacity relative to market revenue share, with top 10 companies holding the majority of large-scale utility market revenue
Innovation Focus Floating offshore wind commercialization, small modular reactor deployment, AI-assisted grid dispatch optimization, direct power purchase agreements with hyperscale data center operators, and battery storage co-located with utility-scale solar generation
M&A Activity Predominantly asset-level acquisitions of renewable operating portfolios and targeted capability acquisitions in battery storage, grid services, and digital energy management platforms rather than large-scale company consolidation among established generators

How Do Companies Compete in the Power Generation Industry?

Companies compete on installed capacity scale, fuel and technology diversification, cost of capital access, and depth of direct bilateral customer relationships with large commercial and industrial buyers executing power purchase agreements. Our findings suggest that generation operators with integrated positions across fuel procurement, grid services, and retail electricity supply are commanding premium valuations relative to pure-play thermal generators, as market revenue increasingly reflects the full-service energy relationship rather than commodity electricity output alone.

Which Competitive Archetypes Dominate the Power Generation Market?

Diversified state-owned conglomerates such as China Energy Investment Corporation and China Huaneng Group Co., Ltd. dominate by installed capacity, leveraging government balance-sheet backing to finance large-scale coal, hydro, and wind assets that market-rate capital would price at higher risk premiums. Independent renewable specialists including NextEra Energy, Inc. and Iberdrola, S.A. differentiate through project development velocity and cost-of-capital leadership in solar and wind markets, while vertically integrated European utilities including ENGIE SA and Enel S.p.A. compete on full-service energy transition partnerships extending from generation asset ownership to customer retail energy management.

What Innovation and Differentiation Strategies Are Companies Pursuing?

We observed that leading companies are investing in AI-assisted dispatch optimization, direct power purchase agreement origination for hyperscale data center clients, and floating offshore wind development rights to capture technology categories where incumbency advantages are still forming. Innovation differentiation increasingly centers on digital platform capabilities that aggregate generation asset performance with grid service revenue, retail customer management, and energy storage dispatch into unified portfolio optimization engines that single-technology operators cannot replicate at equivalent margin structure.

What M&A and Partnership Activity Is Shaping the Power Generation Market?

Recent M&A activity favors acquisitions of operating renewable portfolios over greenfield development company acquisitions, reflecting the premium placed on contracted revenue streams and interconnected grid positions in markets with congested interconnection queues. Our analysis shows that Constellation Energy Corporation and Vistra Corp. have prioritized nuclear and storage capability expansion through direct asset investment rather than large-scale company acquisition, while European utilities have targeted cross-border renewable operating portfolio consolidation as their primary inorganic growth vector through 2035.

Key Market Players

Based on research conducted by NMSC, the following companies represent the validated set of leading participants across power generation technology categories, geographic regions, and commercial models in the Power Generation Market.

China Energy Investment Corporation China Huaneng Group Co., Ltd. China Huadian Corporation Ltd. State Power Investment Corporation Limited China Datang Corporation Ltd. China Three Gorges Corporation Électricité de France Korea Electric Power Corporation China General Nuclear Power Corporation ENGIE SA Enel S.p.A. NTPC Limited JERA Co., Inc. NextEra Energy, Inc. Iberdrola, S.A. Duke Energy Corporation Southern Company RWE AG Vistra Corp. Constellation Energy Corporation

Latest Developments

We found that recent corporate activity reflects continued large-scale renewable capacity commitment, nuclear asset reactivation, and emerging green hydrogen integration projects across leading Power Generation Market participants, even as overall competitive intensity remains concentrated among established state-owned and integrated utility operators.

Date Event
September 2026 NTPC Renewable Energy declared commercial operation of 56.7 MW of additional wind capacity in Gujarat, comprising 6.3 MW from the Vanki Wind Energy Project at Nakhatrana , at Jamnagar.
September 2026 Constellation and Toyota announced a 15-year renewable energy agreement supporting more than 100 MW of new solar generation in Texas. Separately, Constellation signed a long-term PPA with Ferrovial for more than 115 MW from Ferrovial's 203.97 MW Milano Solar project in Milam County, Texas.

Investment Opportunities

Where Are Capital Inflows Concentrating in the Power Generation Market?

Capital concentration is highest in utility-scale solar and offshore wind development, reflecting the convergence of lowest-cost generation economics, sovereign policy support, and institutional investor appetite for long-duration contracted renewable asset classes. The International Energy Agency reported that global clean energy investment reached USD 2 trillion for the first time in 2024, a watershed figure confirming that the energy transition is now attracting capital at a scale that is structurally durable rather than dependent on any single policy cycle. Sovereign wealth funds, infrastructure funds, and corporate strategic investors are allocating simultaneously, creating multi-layer capital structures that accelerate deployment timelines across both utility-scale and distributed generation categories.

How Is Infrastructure Investment Shaping Long-Term Generation Capacity?

Infrastructure investment is concentrating on transmission grid buildout, battery storage, and hydrogen production co-located with renewable generation assets, reflecting the systemic requirements of operating high-renewable-penetration power systems at grid reliability standards. Our findings suggest that grid and storage infrastructure investment is now tracking broadly in parallel with renewable generation investment in advanced markets, with the U.S. Department of Energy’s Grid Deployment Office managing over USD 25 billion in federal transmission and storage grant programs under the Infrastructure Investment and Jobs Act. This capital allocation is creating durable demand for generation assets capable of integrating with modernized grid infrastructure across planning horizons extending to 2035.

What ESG Considerations Are Influencing Investment Decisions in the Power Generation Market?

Environmental, Social, and Governance considerations are reshaping generation asset capital allocation more decisively in the power sector than in most other capital-intensive industries, given the direct link between generation technology choice and national carbon inventory outcomes. We found that investors are applying coal divestment mandates that are materially constraining new capital access for unabated coal generation assets across OECD markets, while simultaneously expanding capital availability for solar, wind, nuclear, and gas-with-carbon-capture technologies under transition-finance frameworks. Responsible investment criteria tied to workforce transition planning, water use management, and community benefit-sharing are increasingly embedded in project finance term sheets, particularly for large-scale renewable developments in emerging markets.

Key Benefits for Stakeholders

How Does This Report Benefit Industry Leaders?

Industry leaders gain segment-level revenue forecasts and CAGR benchmarks across generation technology, operating mode, grid connection, and sales channel axes, enabling capacity planning and technology mix decisions grounded in the consistent 2025–2035 figures used throughout this analysis. Regional growth differentials and 15-country-level estimates further inform market-entry sequencing, bilateral power purchase agreement origination targeting, and regulatory engagement priorities across the 38 countries covered.

How Does This Report Benefit Investors and Financial Analysts?

Investors and financial analysts gain a reconciled market-sizing model, competitive-landscape assessment, and named-company development tracking that supports generation asset valuation and capital-allocation decisions across the investment universe spanning state-owned enterprises, independent power producers, utility conglomerates, and renewable project developers. The Growth Catalyst & Risk Assessment Matrix quantifies driver and restraint impact on CAGR, aiding portfolio scenario analysis for the USD 2,630.99 Billion absolute market opportunity created between 2026 and 2035.

How Does This Report Benefit Technology Vendors and Product Teams?

Technology vendors and product teams gain visibility into which generation technology segments , particularly Solar Generation at 15.07% CAGR and Off-grid at 11.82% CAGR , are growing fastest, informing where to prioritize engineering investment and commercial deployment focus through 2035. Competitive landscape intelligence on M&A activity and digital platform differentiation strategy provides additional signal for positioning hardware, software, and service offerings against the market’s evolving technology procurement patterns and generation operator consolidation dynamics.

Key Market Segments Evaluated

By Generation Technology

  • Thermal Generation 
    • Coal Generation
      • Anthracite and Bituminous Coal
      • Sub-bituminous Coal
      • Lignite
    • Natural Gas Generation
      • Combined Cycle Gas Turbine
      • Simple Cycle Gas Turbine
      • Reciprocating Engine
      • Steam Turbine
    • Oil Generation
      • Heavy Fuel Oil
      • Diesel
      • Other Oil Generation
    • Other Thermal Generation
  • Nuclear Generation 
    • Pressurized Water Reactor
    • Boiling Water Reactor
    • Other Reactor Types
  • Hydro Generation 
    • Conventional Hydroelectric
    • Pumped Storage Hydroelectric
  • Wind Generation 
    • Onshore Wind
    • Offshore Wind
  • Solar Generation 
    • Solar Photovoltaic
    • Concentrated Solar Power
  • Bioenergy Generation 
    • Solid Biomass
    • Biogas
    • Biogenic Waste
  • Geothermal Generation
  • Marine Generation 
    • Tidal Generation
    • Wave Generation
    • Other Marine Generation
  • Fuel Cell Generation
  • Other Generation

By Operating Mode

  • Power-only Generation
  • Combined Heat and Power

By Grid Connection

  • Grid-connected
  • Behind-the-meter
  • Off-grid

By Sales Channel

  • Wholesale Market 
    • Utility Buyer
    • Retailer Buyer
    • Trader
    • Aggregator
    • Industrial Buyer
    • Commercial Buyer
    • Other Wholesale Buyer
  • Retail Market 
    • Residential Consumer
    • Commercial Consumer
    • Industrial Consumer
    • Transportation Consumer
    • Agricultural Consumer
    • Public Sector Consumer
    • Other Retail Consumer

By Region

  • North America 
    • U.S.
    • Canada
    • Mexico
  • Europe 
    • UK
    • Germany
    • France
    • Italy
    • Spain
    • Sweden
    • Denmark
    • Finland
    • Netherlands
    • Rest of Europe
  • Asia-Pacific 
    • China
    • India
    • Japan
    • South Korea
    • Taiwan
    • Indonesia
    • Vietnam
    • Australia
    • Philippines
    • Malaysia
    • Rest of APAC
  • Middle East & Africa 
    • Saudi Arabia
    • UAE
    • Egypt
    • Israel
    • Turkey
    • Nigeria
    • South Africa
    • Rest of MEA
  • Latin America 
    • Brazil
    • Argentina
    • Chile
    • Colombia
    • Rest of LATAM

Conclusion & Recommendations

The long-term outlook for the Power Generation Market remains structurally positive, with the market expanding from USD 2,726.67 Billion in 2026 to USD 5,357.66 Billion by 2035 at a 7.79% CAGR, driven by electrification demand growth and renewable cost deflation. We observed that this trajectory is underpinned by sovereign energy security mandates, technology cost learning curves, and institutional capital appetite for infrastructure-grade renewable assets that make the growth scenario durable across plausible macroeconomic conditions through the full forecast window.

What Strategic Positioning Do We Recommend?

Our assessment indicates that generation operators should prioritize expanding renewable portfolios with integrated storage and demand-response capabilities, targeting distribution system operator channel relationships that increasingly centralize procurement decisions at multi-site industrial and commercial accounts. Companies without established digital grid service capabilities should pursue platform partnerships rather than greenfield technology development, given the market’s clear shift toward integrated dispatch, storage, and retail energy management as the competitive differentiator separating margin leaders from commodity-positioned thermal generators.

How Attractive Is the Power Generation Market for Investment?
Investment attractiveness is highest in Asia-Pacific and MEA given CAGR profiles of 8.76% and 8.95% respectively, while North America offers the largest depth of contracted revenue opportunity through the IRA’s investment incentive architecture. We found that Solar Generation at 15.07% CAGR and Off-grid connection at 11.82% CAGR offer the strongest segment growth profiles through the forecast period, while nuclear capacity restarts and new-build in selective markets offer long-duration contracted cash flow characteristics particularly suited to infrastructure fund mandates.

What Are the Key Market Shifts and Risks?

Key risks include regulatory and permitting delays systematically extending project lead times in the United States and Europe, high capital cost requirements for offshore wind and nuclear creating financing risk concentration in a limited pool of investment-grade developers, and grid integration challenges as variable renewable penetration approaches levels requiring system-scale balancing solutions not yet commercially proven at sufficient scale. Our analysis shows that companies unable to integrate storage and demand-response with their generation portfolios risk competitive displacement as market designs evolve to reward flexible, dispatchable, or storage-coupled output over intermittent-only generation.

What Are the Primary Growth Pathways Through 2035?

Primary growth pathways include solar generation capacity expansion across both utility-scale and distributed categories, offshore wind development transitioning from fixed-bottom to floating platform technology, advanced nuclear reactor commercialization for firm low-carbon baseload, and behind-the-meter generation and storage integration targeting corporate and industrial consumers executing bilateral power purchase agreements. We observed that companies combining renewable generation ownership with digital grid service capabilities, storage co-investment, and direct customer energy contracting are best positioned to capture a disproportionate share of the USD 2,630.99 Billion absolute opportunity created between 2026 and 2035.

Delivered Customizations

We have successfully delivered the following deep-dive customizations:

Client Request Customization Delivered Value Adds
Historical Generation and Capacity Trend Analysis
  • Historical installed capacity, electricity generation (TWh), and revenue analysis across generation technologies, operating modes, and grid connection types.
  • Identifies structural growth shifts and technology transition trends to guide investment timing.
Company-Level Generation Volume Benchmarking
  • Company-level installed capacity and electricity output (MW and TWh) benchmarking for major utilities and independent power producers by generation technology.
  • Highlights producer scale, portfolio mix, and capacity-factor differences to support competitive positioning and M&A screening.
Company-Level Technology Revenue Split
  • Revenue and generation split by technology (thermal, nuclear, hydro, wind, solar and others) for companies that publicly disclose segment data.
  • Shows each player's technology exposure and transition progress to inform partnership and acquisition targeting.
Levelized Cost and Dispatch Economics Benchmarking
  • Country-level LCOE, capacity factor, and merit-order dispatch comparison across generation technologies and operating modes (baseload, mid-merit, peaking) using agency and regulator data.
  • Pinpoints the most competitive technology and operating-mode mix per country for project and asset planning.
Grid-Connected vs Off-Grid Capacity Opportunity Mapping
  • Country-wise capacity additions, electrification gaps, and pipeline mapping for on-grid, off-grid, and distributed generation by technology.
  • Prioritizes geographies and deployment models for market entry and distributed generation expansion.
Sales Channel and Offtake Structure Assessment
  • Electricity volume split by sales channel, covering utility sales, PPAs, merchant and wholesale markets, and direct or retail supply, across key countries.
  • Supports contracting strategy and revenue-risk assessment through clearer visibility of offtake models and price exposure.

FAQs

About the Author

Mayurima Roy

Mayurima Roy

Mayurima Roy is Research Analyst at Next Move Strategy Consulting, where she has spent 4 years working across the firm's full industry coverage rather than a single fixed vertical. Her work centers on structured research, ongoing trend tracking, competitive assessment, and insight-led content development, translating complex market data into clear, decision-ready narratives that support informed client decision-making across diverse global industries, market sectors, and world regions every day.

About the Reviewer

Supradip Baul

Supradip Baul

Supradip Baul is an accomplished business consultant and strategist with over a decade of rich experience in market intelligence, strategy, technology, and business transformation. His work has included rigorous qualitative and quantitative analysis across multiple industries, helping clients shape investment decisions and long-term roadmaps. Earlier in his career, he was associated with Gartner, where he contributed to industry-leading reports and market share analyses. He has worked with leading global companies and holds an MBA with a dual specialization in Marketing and Finance.

Download Free Sample

Diana Trejo

DIANA TREJO

Assistant Manager

Sumitomo Corporation de Mexico, S.A. de C.V.

Recently, we purchased a report on the Mexico Data Center Market from Next Move Strategy Consulting. The service has been excellent, with support that is always timely and thoroughly professional. The information provided is interesting, highly useful, and delivered with clarity. I would highly recommend NextMSC for anyone seeking insightful and dependable analysis.

Pratyush Kumar Das

PRATYUSH KUMAR DAS

Assistant Manager

Polycab India Limited

We would like to express our appreciation for the data and insights provided by nextmsc. We are very pleased with the quality and depth of the information, which has proven to be highly valuable and beneficial for our business decision-making.

Kevin Coker

KEVIN COKER

Founder, CEO and Board Diector

Proxima Clinical Research

I have been using Next MSC reports for product positioning in a new geography for a long time. They have by far the best reports I have found and the price is reasonable too!

Mohit Agarwal

MOHIT AGARWAL

Chief Manager

DryChem India Pvt. Ltd.

Next Move Strategy Consulting is an amazing team of consultants. We required a market study report for our investors on top priority and the team went above and beyond our expectations to deliver the same with ample supporting data within a short time span enabling us to secure the investments and keep our project timeline maintained. Their professionalism, attention to detail, and timely delivery of actionable recommendations have left a lasting impression on our organization.

Nishant Awate

NISHANT AWATE

Business Development Global Sales

Zehnder Group Deutschland GmbH

Our experience working with Next Move Strategy Consulting was positive. The team was responsive, professional, and open to incorporating our specific requirements throughout the project. The India AHU market study was comprehensive and well structured, covering market value and volume forecasts, product and application segments, and key industry trends. The inclusion of both AHU and residential MVHR market insights made the study particularly relevant for our strategic market assessment. Overall, the report provides a solid foundation for evaluating market potential, identifying priority segments, and supporting business-development decisions in India.

Custom Market Research Services

We will customize the research for you if the listed report does not fully match your requirements.

Get 30% Free Customization

Select License

This website uses cookies to ensure you get the best experience on our website. Learn more

✖