Taiwan Air Spring Market by Type (Convolute, Rolling Lobe, and Sleeve), Sales Channel (Original Equipment Manufacturer (OEM) and Aftermarket), and Application (Automotive, Railway, and Industrial) – Global Opportunity Analysis and Industry Forecast, 2024–2030

Taiwan Air Spring Market

Industry:  Automotive & Transportation | Publish Date: Jul 2024 | No of Pages:  125 | No. Tables:  92 | No. Figures:  57

Taiwan Air Spring Market Overview

The Taiwan Air Spring Market size was valued at USD 68.9 million in 2023, and is predicted to reach USD 97.2 million by 2030, at a CAGR of 4.0% from 2024 to 2030. Also, the air spring market is valued at 373 thousand units in 2023, and is expected to reach at 574 thousand units by 2030 with the CAGR of 5.1% during 2024-2030.

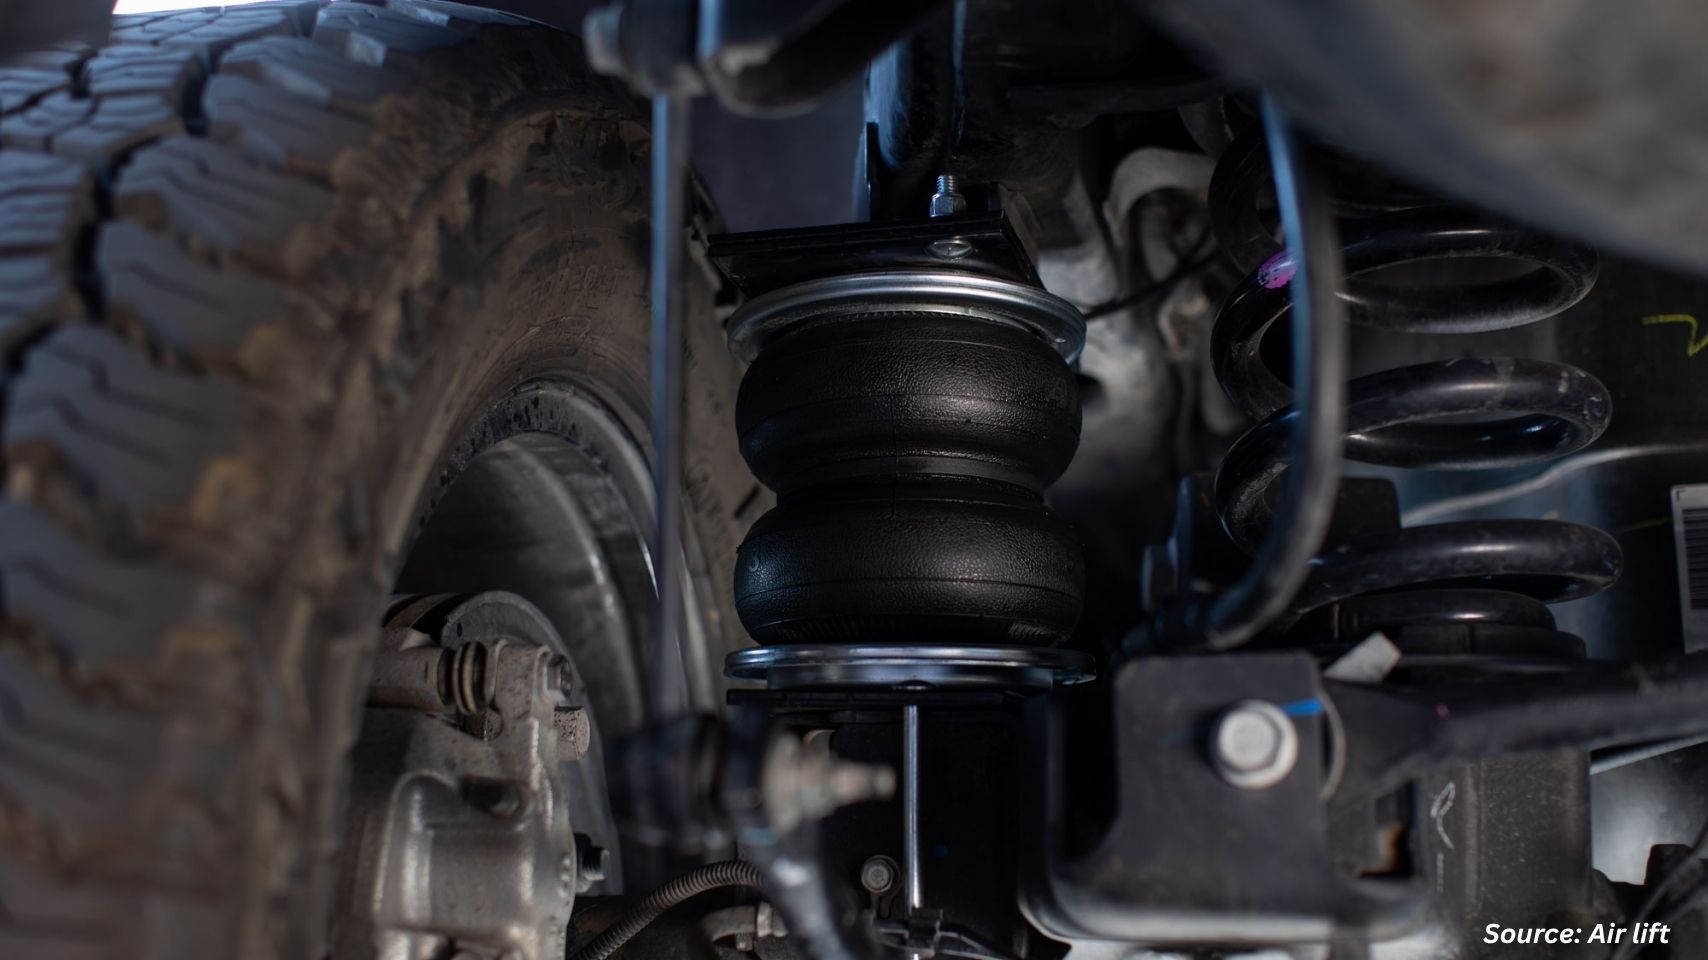
The air spring, also known as air bags or pneumatic springs refers to the industry focused on the production and distribution of these springs, which are components used in vehicle suspension systems to provide improved ride quality, comfort, and stability. It is a component used in commercial vehicles, passenger cars, and industrial machinery.

The component is designed to support loads, isolate vibrations and shocks, and act as a pneumatic cylinder by expanding itself. They are integral components of air suspension systems, providing improved comfort compared to traditional coil springs. These springs replaces traditional metal springs with a flexible, rubber-and-fabric bladder that contains compressed air, making them a popular choice for various applications. 

The Rising Automotive Industry is Driving the Air Spring Market Growth

The growing automotive industry in Taiwan is self-assured to significantly drive the air spring market by increasing the demand for these components within the automotive sector. According to the Taiwan Transportation Vehicle Manufacturers Association (TTVMA), the automotive industry in Taiwan experienced a substantial increase of 61% from January 2023 to January 2024.

This increase in automotive production and sales directly translates into heightened demand for air springs, which are essential for enhancing vehicle ride comfort, stability, and performance. Consequently, this growth in the automotive sector is a key contributor to the expansion of the air spring market in Taiwan.


The Growing Urbanization is Driving Demand for Air Springs

The continuous growth of urbanization in Taiwan further boosts the air spring market by escalating the need for advanced transportation solutions that provide enhanced comfort and stability in urban environments.

According to data from the Central Intelligence Agency (CIA), Taiwan’s urbanization rate stood at 80.1% in 2023 and is projected to increase annually at a rate of 0.65% until 2025. This ongoing urbanization trend drives demand for air springs in both passenger and commercial vehicles, as these components are crucial for ensuring smooth and comfortable rides in densely populated urban areas. As a result, the increasing urbanization significantly contributes the Taiwan air spring market demand.


The High Complexity in Installing Air Springs Hinders the Market Growth

The installation process for these springs presents a formidable challenge, impeding market expansion. Specialized knowledge and tools are requisite for air bag installation, resulting in increased time and costs for both manufacturers and end-users.

Furthermore, the intricate installation procedure is prone to errors or inefficiencies, thereby compromising overall performance and reliability. Consequently, the complexities associated with air spring installation dissuade potential customers from embracing these products, consequently restricting the Taiwan air spring market expansion.

The Integration of Sensor Technology in Air Springs Creates Opportunity

The incorporation of sensor technology into these springs is anticipated to unlock future market prospects. By integrating sensors into air bag systems, manufacturers can conduct real-time monitoring of pressure, temperature, and other critical parameters. This capability facilitates proactive maintenance, predictive analytics, and enhanced performance optimization, thereby boosting reliability and safety.

Furthermore, sensor-enabled air springs are poised to catalyze the development of intelligent, adaptive suspension systems capable of automatically adapting to diverse road conditions and driving dynamics.

With the automotive AI and industrial sectors increasingly prioritizing efficiency and automation, the demand for sensor-equipped air bags is expected to engender substantial growth opportunities in the foreseeable future.

Notably, key players in this domain such as Continental AG and Vibracoustic are spearheading innovation by integrating ultrasonic sensors into their air bags, underscoring the industry's dedication to advancement and progress.


Competitive Landscape

The promising key players operating in the Taiwan air spring industry include Continental AG, Bridgestone Industrial, Vibracoustic SE, Sumitomo Electric Industries, Ltd., Trelleborg AB, VDL Groep, Airtech (Akta? Holding), Hendrickson USA, L.L.C., BWI Group, Stemco, among others.

Taiwan Air Spring Market Key Segments

By Type

  • Convolute

    • Single

    • Multi

  • Rolling Lobe

  • Sleeve

By Sales Channel 

  • Original Equipment Manufacturer (OEM)

  • Aftermarket

By Application

  • Automotive

    • Passenger Cars

    • Buses

    • Trailer and Trucks    

  • Railways    

  • Industrial

REPORT SCOPE AND SEGMENTATION:

Parameters

Details

Market Size Value in 2023

USD 68.9 million

Revenue Forecast in 2030

USD 97.2 million

Market Size Volume in 2023

373 thousand units

Volume Forecast in 2030

574 thousand units

Value Growth Rate

CAGR of 4.0% from 2024 to 2030

Volume Growth Rate

CAGR of 5.1% from 2024-2030

Analysis Period

2023–2030

Base Year Considered

2023

Forecast Period

2024–2030

Market Size Estimation

Million (USD)

Market Volume Estimation

Thousand Units

Growth Factors

  • The rising automotive industry is driving the air spring market growth
  • The growing urbanization is driving demand for air springs in the country

Companies Profiled

10

Customization Scope

Free customization (equivalent up to 80 working hours of analysts) after purchase. Addition or alteration to country, regional, and segment scope.

Pricing and Purchase Options

Avail customized purchase options to meet your exact research needs.

Test

1      INTRODUCTION

           1.1      REPORT DESCRIPTION

           1.2      RESEARCH METHODOLOGY

                         1.2.1      SECONDARY RESEARCH

                         1.2.2      DATA ANALYSIS FRAMEWORK

                         1.2.3      MARKET SIZE ESTIMATION

                         1.2.4      FORECASTING

                         1.2.5      PRIMARY RESEARCH AND DATA VALIDATION

2      TAIWAN AIR SPRING MARKET – EXECUTIVE SUMMARY

           2.1.      MARKET SNAPSHOT, 2023 - 2030, MILLION USD

3      PORTER’S FIVE FORCE MODEL ANALYSIS

           3.1      BARGAINING POWER OF SUPPLIERS

           3.2      BARGAINING POWER OF BUYERS

           3.3      DEGREE OF COMPETITION

           3.4      THREAT OF SUBSTITUTE

           3.5      THREAT OF NEW ENTRANTS

4      MARKET SHARE ANALYSIS

           4.1      MARKET SHARE ANALYSIS OF TOP PROVIDERS, 2023

5      MARKET DYNAMICS

           5.1      GROWTH DRIVERS

                         5.1.1      DRIVER 1

                         5.1.2      DRIVER 2

                         5.1.3      DRIVER 3

                         5.1.4      DRIVER 4

           5.2      CHALLENGES

                         5.2.1      CHALLENGE 1

                         5.2.2      CHALLENGE 2

                         5.2.3      CHALLENGE 3

                         5.2.4      CHALLENGE 4

           5.3      OPPORTUNITIES

                         5.3.1      OPPORTUNITY 1

                         5.3.2      OPPORTUNITY 2

6       TAIWAN AIR SPRING MARKET BY TYPE

           6.1      OVERVIEW

           6.2      CONVOLUTE MARKET

                         6.2.1      SINGLE

                         6.2.2      MULTI

           6.3      ROLLING LOBE MARKET

           6.4      SLEEVE MARKET

7       TAIWAN AIR SPRING MARKET BY SALES CHANNEL

           7.1      OVERVIEW

           7.2      ORIGINAL EQUIPMENT MANUFACTURER (OEM) MARKET

           7.3      AFTERMARKET MARKET

8       TAIWAN AIR SPRING MARKET BY APPLICATION

           8.1      OVERVIEW

           8.2      AUTOMOTIVE MARKET

                         8.2.1      PASSENGER CARS

                         8.2.2      BUSES

                         8.2.3      TRAILER AND TRUCKS

           8.3      RAILWAYS MARKET

           8.4      INDUSTRIAL MARKET

9     COMPANY PROFILES

           9.1     CONTINENTAL AG

                         9.1.1     COMPANY OVERVIEW

                         9.1.2     COMPANY SNAPSHOT

                         9.1.3     OPERATING BUSINESS SEGMENTS

                         9.1.4     PRODUCT PORTFOLIO

                         9.1.5     BUSINESS PERFORMANCE

                         9.1.6     BUSINESS SEGMENTS

                         9.1.7     GEOGRAPHIC SEGMENTS

                         9.1.8     KEY STRATEGIC MOVES AND DEVELOPMENT

                         9.1.9     PRIMARY MARKET COMPETITORS

           9.2     BRIDGESTONE INDUSTRIAL

                         9.2.1     COMPANY OVERVIEW

                         9.2.2     COMPANY SNAPSHOT

                         9.2.3     OPERATING BUSINESS SEGMENTS

                         9.2.4     PRODUCT PORTFOLIO

                         9.2.5     BUSINESS PERFORMANCE

                         9.2.6     BUSINESS SEGMENTS

                         9.2.7     GEOGRAPHIC SEGMENTS

                         9.2.8     KEY STRATEGIC MOVES AND DEVELOPMENT

                         9.2.9     PRIMARY MARKET COMPETITORS

           9.3     VIBRACOUSTIC SE

                         9.3.1     COMPANY OVERVIEW

                         9.3.2     COMPANY SNAPSHOT

                         9.3.3     OPERATING BUSINESS SEGMENTS

                         9.3.4     PRODUCT PORTFOLIO

                         9.3.5     BUSINESS PERFORMANCE

                         9.3.6     BUSINESS SEGMENTS

                         9.3.7     GEOGRAPHIC SEGMENTS

                         9.3.8     KEY STRATEGIC MOVES AND DEVELOPMENT

                         9.3.9     PRIMARY MARKET COMPETITORS

           9.4     SUMITOMO ELECTRIC INDUSTRIES, LTD.

                         9.4.1     COMPANY OVERVIEW

                         9.4.2     COMPANY SNAPSHOT

                         9.4.3     OPERATING BUSINESS SEGMENTS

                         9.4.4     PRODUCT PORTFOLIO

                         9.4.5     BUSINESS PERFORMANCE

                         9.4.6     BUSINESS SEGMENTS

                         9.4.7     GEOGRAPHIC SEGMENTS

                         9.4.8     KEY STRATEGIC MOVES AND DEVELOPMENT

                         9.4.9     PRIMARY MARKET COMPETITORS

           9.5     TRELLEBORG AB

                         9.5.1     COMPANY OVERVIEW

                         9.5.2     COMPANY SNAPSHOT

                         9.5.3     OPERATING BUSINESS SEGMENTS

                         9.5.4     PRODUCT PORTFOLIO

                         9.5.5     BUSINESS PERFORMANCE

                         9.5.6     BUSINESS SEGMENTS

                         9.5.7     GEOGRAPHIC SEGMENTS

                         9.5.8     KEY STRATEGIC MOVES AND DEVELOPMENT

                         9.5.9     PRIMARY MARKET COMPETITORS

           9.6     VDL GROEP

                         9.6.1     COMPANY OVERVIEW

                         9.6.2     COMPANY SNAPSHOT

                         9.6.3     OPERATING BUSINESS SEGMENTS

                         9.6.4     PRODUCT PORTFOLIO

                         9.6.5     BUSINESS PERFORMANCE

                         9.6.6     BUSINESS SEGMENTS

                         9.6.7     GEOGRAPHIC SEGMENTS

                         9.6.8     KEY STRATEGIC MOVES AND DEVELOPMENT

                         9.6.9     PRIMARY MARKET COMPETITORS

           9.7     AIRTECH (AKTAS HOLDING)

                         9.7.1     COMPANY OVERVIEW

                         9.7.2     COMPANY SNAPSHOT

                         9.7.3     OPERATING BUSINESS SEGMENTS

                         9.7.4     PRODUCT PORTFOLIO

                         9.7.5     BUSINESS PERFORMANCE

                         9.7.6     BUSINESS SEGMENTS

                         9.7.7     GEOGRAPHIC SEGMENTS

                         9.7.8     KEY STRATEGIC MOVES AND DEVELOPMENT

                         9.7.9     PRIMARY MARKET COMPETITORS

           9.8     HENDRICKSON USA, L.L.C.

                         9.8.1     COMPANY OVERVIEW

                         9.8.2     COMPANY SNAPSHOT

                         9.8.3     OPERATING BUSINESS SEGMENTS

                         9.8.4     PRODUCT PORTFOLIO

                         9.8.5     BUSINESS PERFORMANCE

                         9.8.6     BUSINESS SEGMENTS

                         9.8.7     GEOGRAPHIC SEGMENTS

                         9.8.8     KEY STRATEGIC MOVES AND DEVELOPMENT

                         9.8.9     PRIMARY MARKET COMPETITORS

           9.9     BWI GROUP

                         9.9.1     COMPANY OVERVIEW

                         9.9.2     COMPANY SNAPSHOT

                         9.9.3     OPERATING BUSINESS SEGMENTS

                         9.9.4     PRODUCT PORTFOLIO

                         9.9.5     BUSINESS PERFORMANCE

                         9.9.6     BUSINESS SEGMENTS

                         9.9.7     GEOGRAPHIC SEGMENTS

                         9.9.8     KEY STRATEGIC MOVES AND DEVELOPMENT

                         9.9.9     PRIMARY MARKET COMPETITORS

           9.10     STEMCO

                         9.10.1     COMPANY OVERVIEW

                         9.10.2     COMPANY SNAPSHOT

                         9.10.3     OPERATING BUSINESS SEGMENTS

                         9.10.4     PRODUCT PORTFOLIO

                         9.10.5     BUSINESS PERFORMANCE

                         9.10.6     BUSINESS SEGMENTS

                         9.10.7     GEOGRAPHIC SEGMENTS

                         9.10.8     KEY STRATEGIC MOVES AND DEVELOPMENT

                         9.10.9     PRIMARY MARKET COMPETITORS

LIST OF TABLES

TABLE 1. TAIWAN AIR SPRING MARKET VALUE, BY TYPE, 2023-2030, (MILLION USD)

TABLE 2. TAIWAN AIR SPRING MARKET VALUE, BY TYPE, 2023-2030, (THOUSAND UNITS)

TABLE 3. CONVOLUTE, MARKET VALUE, 2023-2030, (MILLION USD)

TABLE 4. CONVOLUTE, MARKET VALUE, 2023-2030, (THOUSAND UNITS)

TABLE 5. SINGLE, MARKET VALUE, 2023-2030, (MILLION USD)

TABLE 6. SINGLE, MARKET VALUE, 2023-2030, (THOUSAND UNITS)

TABLE 7. MULTI, MARKET VALUE, 2023-2030, (MILLION USD)

TABLE 8. MULTI, MARKET VALUE, 2023-2030, (THOUSAND UNITS)

TABLE 9. ROLLING LOBE, MARKET VALUE, 2023-2030, (MILLION USD)

TABLE 10. ROLLING LOBE, MARKET VALUE, 2023-2030, (THOUSAND UNITS)

TABLE 11. SLEEVE, MARKET VALUE, 2023-2030, (MILLION USD)

TABLE 12. SLEEVE, MARKET VALUE, 2023-2030, (THOUSAND UNITS)

TABLE 13. TAIWAN AIR SPRING MARKET VALUE, BY SALES CHANNEL, 2023-2030, (MILLION USD)

TABLE 14. TAIWAN AIR SPRING MARKET VALUE, BY SALES CHANNEL, 2023-2030, (THOUSAND UNITS)

TABLE 15. ORIGINAL EQUIPMENT MANUFACTURER (OEM), MARKET VALUE, 2023-2030, (MILLION USD)

TABLE 16. ORIGINAL EQUIPMENT MANUFACTURER (OEM), MARKET VALUE, 2023-2030, (THOUSAND UNITS)

TABLE 17. AFTERMARKET, MARKET VALUE, 2023-2030, (MILLION USD)

TABLE 18. AFTERMARKET, MARKET VALUE, 2023-2030, (THOUSAND UNITS)

TABLE 19. TAIWAN AIR SPRING MARKET VALUE, BY APPLICATION, 2023-2030, (MILLION USD)

TABLE 20. TAIWAN AIR SPRING MARKET VALUE, BY APPLICATION, 2023-2030, (THOUSAND UNITS)

TABLE 21. AUTOMOTIVE, MARKET VALUE, 2023-2030, (MILLION USD)

TABLE 22. AUTOMOTIVE, MARKET VALUE, 2023-2030, (THOUSAND UNITS)

TABLE 23. PASSENGER CARS, MARKET VALUE, 2023-2030, (MILLION USD)

TABLE 24. PASSENGER CARS, MARKET VALUE, 2023-2030, (THOUSAND UNITS)

TABLE 25. BUSES, MARKET VALUE, 2023-2030, (MILLION USD)

TABLE 26. BUSES, MARKET VALUE, 2023-2030, (THOUSAND UNITS)

TABLE 27. TRAILER AND TRUCKS, MARKET VALUE, 2023-2030, (MILLION USD)

TABLE 28. TRAILER AND TRUCKS, MARKET VALUE, 2023-2030, (THOUSAND UNITS)

TABLE 29. RAILWAYS, MARKET VALUE, 2023-2030, (MILLION USD)

TABLE 30. RAILWAYS, MARKET VALUE, 2023-2030, (THOUSAND UNITS)

TABLE 31. INDUSTRIAL, MARKET VALUE, 2023-2030, (MILLION USD)

TABLE 32. INDUSTRIAL, MARKET VALUE, 2023-2030, (THOUSAND UNITS)

TABLE 33. CONTINENTAL AG: COMPANY SNAPSHOT

TABLE 34. CONTINENTAL AG: OPERATING BUSINESS SEGMENTS

TABLE 35. CONTINENTAL AG: PRODUCT PORTFOLIO

TABLE 36. CONTINENTAL AG: SALES BY BUSINESS SEGMENTS (2021-2023)

TABLE 37. CONTINENTAL AG: SALES BY GEOGRAPHIC SEGMENTS (2021-2023)

TABLE 38. CONTINENTAL AG: KEY STRATERGY

TABLE 39. BRIDGESTONE INDUSTRIAL: COMPANY SNAPSHOT

TABLE 40. BRIDGESTONE INDUSTRIAL: OPERATING BUSINESS SEGMENTS

TABLE 41. BRIDGESTONE INDUSTRIAL: PRODUCT PORTFOLIO

TABLE 42. BRIDGESTONE INDUSTRIAL: SALES BY BUSINESS SEGMENTS (2021-2023)

TABLE 43. BRIDGESTONE INDUSTRIAL: SALES BY GEOGRAPHIC SEGMENTS (2021-2023)

TABLE 44. BRIDGESTONE INDUSTRIAL: KEY STRATERGY

TABLE 45. VIBRACOUSTIC SE: COMPANY SNAPSHOT

TABLE 46. VIBRACOUSTIC SE: OPERATING BUSINESS SEGMENTS

TABLE 47. VIBRACOUSTIC SE: PRODUCT PORTFOLIO

TABLE 48. VIBRACOUSTIC SE: SALES BY BUSINESS SEGMENTS (2021-2023)

TABLE 49. VIBRACOUSTIC SE: SALES BY GEOGRAPHIC SEGMENTS (2021-2023)

TABLE 50. VIBRACOUSTIC SE: KEY STRATERGY

TABLE 51. SUMITOMO ELECTRIC INDUSTRIES, LTD.: COMPANY SNAPSHOT

TABLE 52. SUMITOMO ELECTRIC INDUSTRIES, LTD.: OPERATING BUSINESS SEGMENTS

TABLE 53. SUMITOMO ELECTRIC INDUSTRIES, LTD.: PRODUCT PORTFOLIO

TABLE 54. SUMITOMO ELECTRIC INDUSTRIES, LTD.: SALES BY BUSINESS SEGMENTS (2021-2023)

TABLE 55. SUMITOMO ELECTRIC INDUSTRIES, LTD.: SALES BY GEOGRAPHIC SEGMENTS (2021-2023)

TABLE 56. SUMITOMO ELECTRIC INDUSTRIES, LTD.: KEY STRATERGY

TABLE 57. TRELLEBORG AB: COMPANY SNAPSHOT

TABLE 58. TRELLEBORG AB: OPERATING BUSINESS SEGMENTS

TABLE 59. TRELLEBORG AB: PRODUCT PORTFOLIO

TABLE 60. TRELLEBORG AB: SALES BY BUSINESS SEGMENTS (2021-2023)

TABLE 61. TRELLEBORG AB: SALES BY GEOGRAPHIC SEGMENTS (2021-2023)

TABLE 62. TRELLEBORG AB: KEY STRATERGY

TABLE 63. VDL GROEP: COMPANY SNAPSHOT

TABLE 64. VDL GROEP: OPERATING BUSINESS SEGMENTS

TABLE 65. VDL GROEP: PRODUCT PORTFOLIO

TABLE 66. VDL GROEP: SALES BY BUSINESS SEGMENTS (2021-2023)

TABLE 67. VDL GROEP: SALES BY GEOGRAPHIC SEGMENTS (2021-2023)

TABLE 68. VDL GROEP: KEY STRATERGY

TABLE 69. AIRTECH (AKTAS HOLDING): COMPANY SNAPSHOT

TABLE 70. AIRTECH (AKTAS HOLDING): OPERATING BUSINESS SEGMENTS

TABLE 71. AIRTECH (AKTAS HOLDING): PRODUCT PORTFOLIO

TABLE 72. AIRTECH (AKTAS HOLDING): SALES BY BUSINESS SEGMENTS (2021-2023)

TABLE 73. AIRTECH (AKTAS HOLDING): SALES BY GEOGRAPHIC SEGMENTS (2021-2023)

TABLE 74. AIRTECH (AKTAS HOLDING): KEY STRATERGY

TABLE 75. HENDRICKSON USA, L.L.C.: COMPANY SNAPSHOT

TABLE 76. HENDRICKSON USA, L.L.C.: OPERATING BUSINESS SEGMENTS

TABLE 77. HENDRICKSON USA, L.L.C.: PRODUCT PORTFOLIO

TABLE 78. HENDRICKSON USA, L.L.C.: SALES BY BUSINESS SEGMENTS (2021-2023)

TABLE 79. HENDRICKSON USA, L.L.C.: SALES BY GEOGRAPHIC SEGMENTS (2021-2023)

TABLE 80. HENDRICKSON USA, L.L.C.: KEY STRATERGY

TABLE 81. BWI GROUP: COMPANY SNAPSHOT

TABLE 82. BWI GROUP: OPERATING BUSINESS SEGMENTS

TABLE 83. BWI GROUP: PRODUCT PORTFOLIO

TABLE 84. BWI GROUP: SALES BY BUSINESS SEGMENTS (2021-2023)

TABLE 85. BWI GROUP: SALES BY GEOGRAPHIC SEGMENTS (2021-2023)

TABLE 86. BWI GROUP: KEY STRATERGY

TABLE 87. STEMCO: COMPANY SNAPSHOT

TABLE 88. STEMCO: OPERATING BUSINESS SEGMENTS

TABLE 89. STEMCO: PRODUCT PORTFOLIO

TABLE 90. STEMCO: SALES BY BUSINESS SEGMENTS (2021-2023)

TABLE 91. STEMCO: SALES BY GEOGRAPHIC SEGMENTS (2021-2023)

TABLE 92. STEMCO: KEY STRATERGY

LIST OF FIGURES

FIGURE 1. BARGAINING POWER OF SUPPLIERS

FIGURE 2. BARGAINING POWER OF BUYERS

FIGURE 3. DEGREE OF COMPETITION

FIGURE 4. THREAT OF SUBSTITUTE

FIGURE 5. THREAT OF NEW ENTRANTS

FIGURE 6. TAIWAN AIR SPRING MARKET VALUE, BY TYPE, 2023-2030, (MILLION USD)

FIGURE 7. TAIWAN AIR SPRING MARKET VALUE, BY TYPE, 2023-2030, (THOUSAND UNITS)

FIGURE 8. CONVOLUTE, MARKET VALUE, 2023-2030, (MILLION USD)

FIGURE 9. CONVOLUTE, MARKET VALUE, 2023-2030, (THOUSAND UNITS)

FIGURE 10. SINGLE, MARKET VALUE, 2023-2030, (MILLION USD)

FIGURE 11. SINGLE, MARKET VALUE, 2023-2030, (THOUSAND UNITS)

FIGURE 12. MULTI, MARKET VALUE, 2023-2030, (MILLION USD)

FIGURE 13. MULTI, MARKET VALUE, 2023-2030, (THOUSAND UNITS)

FIGURE 14. ROLLING LOBE, MARKET VALUE, 2023-2030, (MILLION USD)

FIGURE 15. ROLLING LOBE, MARKET VALUE, 2023-2030, (THOUSAND UNITS)

FIGURE 16. SLEEVE, MARKET VALUE, 2023-2030, (MILLION USD)

FIGURE 17. SLEEVE, MARKET VALUE, 2023-2030, (THOUSAND UNITS)

FIGURE 18. TAIWAN AIR SPRING MARKET VALUE, BY SALES CHANNEL, 2023-2030, (MILLION USD)

FIGURE 19. TAIWAN AIR SPRING MARKET VALUE, BY SALES CHANNEL, 2023-2030, (THOUSAND UNITS)

FIGURE 20. ORIGINAL EQUIPMENT MANUFACTURER (OEM), MARKET VALUE, 2023-2030, (MILLION USD)

FIGURE 21. ORIGINAL EQUIPMENT MANUFACTURER (OEM), MARKET VALUE, 2023-2030, (THOUSAND UNITS)

FIGURE 22. AFTERMARKET, MARKET VALUE, 2023-2030, (MILLION USD)

FIGURE 23. AFTERMARKET, MARKET VALUE, 2023-2030, (THOUSAND UNITS)

FIGURE 24. TAIWAN AIR SPRING MARKET VALUE, BY APPLICATION, 2023-2030, (MILLION USD)

FIGURE 25. TAIWAN AIR SPRING MARKET VALUE, BY APPLICATION, 2023-2030, (THOUSAND UNITS)

FIGURE 26. AUTOMOTIVE, MARKET VALUE, 2023-2030, (MILLION USD)

FIGURE 27. AUTOMOTIVE, MARKET VALUE, 2023-2030, (THOUSAND UNITS)

FIGURE 28. PASSENGER CARS, MARKET VALUE, 2023-2030, (MILLION USD)

FIGURE 29. PASSENGER CARS, MARKET VALUE, 2023-2030, (THOUSAND UNITS)

FIGURE 30. BUSES, MARKET VALUE, 2023-2030, (MILLION USD)

FIGURE 31. BUSES, MARKET VALUE, 2023-2030, (THOUSAND UNITS)

FIGURE 32. TRAILER AND TRUCKS, MARKET VALUE, 2023-2030, (MILLION USD)

FIGURE 33. TRAILER AND TRUCKS, MARKET VALUE, 2023-2030, (THOUSAND UNITS)

FIGURE 34. RAILWAYS, MARKET VALUE, 2023-2030, (MILLION USD)

FIGURE 35. RAILWAYS, MARKET VALUE, 2023-2030, (THOUSAND UNITS)

FIGURE 36. INDUSTRIAL, MARKET VALUE, 2023-2030, (MILLION USD)

FIGURE 37. INDUSTRIAL, MARKET VALUE, 2023-2030, (THOUSAND UNITS)

FIGURE 38. CONTINENTAL AG: NET SALES, (2021-2023)

FIGURE 39. CONTINENTAL AG: PRIMARY MARKET COMPETITORS

FIGURE 40. BRIDGESTONE INDUSTRIAL: NET SALES, (2021-2023)

FIGURE 41. BRIDGESTONE INDUSTRIAL: PRIMARY MARKET COMPETITORS

FIGURE 42. VIBRACOUSTIC SE: NET SALES, (2021-2023)

FIGURE 43. VIBRACOUSTIC SE: PRIMARY MARKET COMPETITORS

FIGURE 44. SUMITOMO ELECTRIC INDUSTRIES, LTD.: NET SALES, (2021-2023)

FIGURE 45. SUMITOMO ELECTRIC INDUSTRIES, LTD.: PRIMARY MARKET COMPETITORS

FIGURE 46. TRELLEBORG AB: NET SALES, (2021-2023)

FIGURE 47. TRELLEBORG AB: PRIMARY MARKET COMPETITORS

FIGURE 48. VDL GROEP: NET SALES, (2021-2023)

FIGURE 49. VDL GROEP: PRIMARY MARKET COMPETITORS

FIGURE 50. AIRTECH (AKTAS HOLDING): NET SALES, (2021-2023)

FIGURE 51. AIRTECH (AKTAS HOLDING): PRIMARY MARKET COMPETITORS

FIGURE 52. HENDRICKSON USA, L.L.C.: NET SALES, (2021-2023)

FIGURE 53. HENDRICKSON USA, L.L.C.: PRIMARY MARKET COMPETITORS

FIGURE 54. BWI GROUP: NET SALES, (2021-2023)

FIGURE 55. BWI GROUP: PRIMARY MARKET COMPETITORS

FIGURE 56. STEMCO: NET SALES, (2021-2023)

FIGURE 57. STEMCO: PRIMARY MARKET COMPETITORS

KEY PLAYERS

  • Continental AG

  • Bridgestone Industrial

  • Vibracoustic SE

  • Sumitomo Electric Industries, Ltd.

  • Trelleborg AB

  • VDL Groep

  • Airtech (Akta? Holding)

  • Hendrickson USA, L.L.C.

  • BWI Group

  • Stemco


Frequently Asked Questions
What is the size of Taiwan air spring market 2030?

Taiwan air spring market is projected to grow at a CAGR of 4.0% to reach USD 97.2 million by 2030.

Which are the key players operating in Taiwan air spring market?

The key players in Taiwan air spring market include Continental AG, Bridgestone Industrial, Vibracoustic SE, Sumitomo Electric Industries, Ltd., Trelleborg AB, and others.

What is the size of Taiwan air spring market in 2023?

Taiwan air spring market was valued at USD 68.9 million in 2023

What are the restraining factors in Taiwan air spring market?

The high complexities associated with the installation of air spring hinders the market.

What are the opportunities in Taiwan air spring market?

The integration of sensor-based technologies creates opportunities for the air spring in the coming future.