Video Games Market Global Industry Analysis and Forecast (2026-2035)

Video Games Market size was USD 300 Billion in 2025, projected to reach USD 780 Billion by 2035, growing at a CAGR of 9.9% from 2026 to 2035. Key drivers include rising smartphone penetration, cloud gaming infrastructure, subscription-based gaming, and esports, with Asia-Pacific leading the market.

Download Free Sample PDF
Base Year (2025)
$300.00 Billion
Forecast (2035)
$780.00 Billion
CAGR (2026-2035)
9.9%
Top Region
Asia-Pacific

Market Size & Forecast

Global Revenue Forecast

Values in USD Billion

2025 $300.00 Billion
2025
2026 $329.70 Billion
2026
2027 $362.34 Billion
2027
2028 $398.21 Billion
2028
2029 $437.63 Billion
2029
2030 $480.96 Billion
2030
2031 $528.58 Billion
2031
2032 $580.90 Billion
2032
2033 $638.41 Billion
2033
2034 $701.62 Billion
2034
2035 $780.00 Billion
2035

Market Overview

What Is the Video Games Market Size?

The global video games market size was valued at USD 300.0 Billion in 2025 and is estimated to grow from USD 332.0 Billion in 2026 to USD 780.0 Billion by 2035, expanding at a CAGR of 9.9% between 2026 and 2035. Asia-Pacific led the video games market with an approximate 45% revenue share in 2025, while Mobile remained the dominant platform segment with an approximate 40% share of global revenue.

We observed that the video games market's momentum is best captured through a concise set of indicators before deeper analysis follows.

What does the Video Games Market Encompass?

The video games market encompasses the global development, publishing, distribution, and monetization of interactive digital entertainment across mobile, PC, console, cloud, and emerging web-based platforms. Our assessment indicates that the market's scope spans engine and content development studios, platform holders, digital storefronts, and physical retail channels, with revenue realized through unit sales, in-game purchases, advertising, and recurring subscriptions across a global base of players spanning children through older adults.

Structurally, the industry has evolved from disc-based retail distribution toward digital-first delivery, live-service content models, and cross-platform play. We found that regulatory attention on loot-box mechanics, data privacy for minors, and platform-store commission structures is intensifying across the European Union, South Korea, and parts of Asia-Pacific, while technology adoption trends in cloud streaming, generative AI-assisted content creation, and immersive AR/VR devices continue to widen the addressable player base and compress content development cycles.

Key Takeaways

By Platform: Mobile held the dominant position at approximately USD 120.0 billion in 2025 and is projected to reach USD 296.4 billion by 2035; Cloud Gaming is the fastest-growing sub-segment at 18.0% CAGR from 2026–2035.

By Game Genre: Action held the dominant position at approximately USD 66.0 billion in 2025 and is projected to reach USD 163.8 billion by 2035; Casual and Puzzle is the fastest-growing sub-segment at 13.2% CAGR from 2026–2035.

By Business Model: Free to Play held the dominant position at approximately USD 174.0 billion in 2025 and is projected to reach USD 405.6 billion by 2035; Subscription is the fastest-growing sub-segment at 15.8% CAGR from 2026–2035.

Dominant Region: Asia-Pacific dominated with approximately USD 135.0 billion in 2025 and is projected to reach USD 327.6 billion by 2035.

Fastest-Growing Region: Middle East & Africa is expected to register the highest CAGR of 18.0% during 2026–2035.

Dominant Country: China was the largest single national contributor within the Asia-Pacific region.

Fastest-Growing Country: Saudi Arabia is the fastest-growing country, with a CAGR outpacing the regional Middle East & Africa average.

Market Opportunity: The video games market is projected to generate an incremental revenue opportunity of approximately USD 448.0 Billion between 2026 and 2035, reflecting the absolute dollar gap between the 2035 forecast and the 2026 base value a signal of the scale of investment now flowing into platform infrastructure, live-service content, and cross-border distribution.

According to Next Move Strategy Consulting analysis, subscription-based monetization and cloud-delivered gaming are structurally reshaping revenue capture away from one-time unit sales, a shift that rewards publishers with durable engagement metrics over those reliant on periodic blockbuster releases.

Market Drivers & Dynamics

Interactive Dataset
Smartphone and mobile broadband penetration driver +2.1% Asia-Pacific, LATAM, MEA 2026–2035
Growth of cloud gaming infrastructure driver +1.4% Global 2026–2032
Expansion of subscription bundles driver +1.2% North America, Europe 2026–2035
Rising esports viewership and sponsorship driver +0.9% Global 2026–2033
Generative AI-assisted content development driver +0.8% Global 2027–2035
Increasing regulatory scrutiny of loot-box mechanics restraint −0.6% Europe, South Korea 2026–2030
Console and PC hardware upgrade costs restraint −0.5% North America, Europe 2026–2035
Piracy and unauthorized distribution restraint −0.4% Asia-Pacific, LATAM 2026–2035
Data privacy compliance for minors restraint −0.3% North America, Europe 2026–2032
Source: Next Move Strategy Consulting

Growth Drivers

What Is the Primary Growth Driver for the Video Games Market?

Smartphone penetration remains the primary growth driver, as mobile devices provide the lowest-friction entry point for new players across price-sensitive geographies. The Entertainment Software Association reported that U.S. consumer spending on video games reached USD 60.7 billion in 2025, an increase of 1.4% from 2024, underscoring sustained demand even in a mature market. As device affordability improves across Asia-Pacific and Latin America, mobile-first onboarding is expected to keep expanding the global player base through 2035.

How Is Cloud Infrastructure Driving Market Growth?

Cloud gaming infrastructure is driving growth by removing hardware as a barrier to premium content access. Company analysis indicates that streaming-capable catalogs allow publishers to monetize markets previously excluded by console or high-end PC costs. Based on research conducted by Next Move Strategy Consulting, we found that data center buildouts supporting low-latency streaming are concentrated in North America, Western Europe, and coastal Asia-Pacific, directly shaping where cloud-first monetization scales fastest.

Growth Inhibitors

What Is Restraining the Video Games Market?

Regulatory scrutiny of loot-box and randomized in-game purchase mechanics is restraining monetization flexibility, particularly across the European Union and South Korea, where disclosure and age-gating requirements have tightened. We observed that compliance costs disproportionately affect smaller free-to-play studios lacking dedicated legal teams. Belgium and the Netherlands have taken formal regulatory positions on loot-box classification, a pattern other European Union member states are monitoring closely for potential replication.

Growth Opportunities

Can Cross-Platform Cloud Bundling Unlock Emerging-Market Demand?

Publishers pairing cloud streaming with prepaid mobile data bundles can reach price-sensitive players across Southeast Asia and Sub-Saharan Africa who lack console-grade hardware. This mechanism primarily benefits cloud-native platform operators and telecom-partnered distributors seeking incremental subscriber revenue.

Will AI-Personalized Live-Service Content Extend Player Lifetime Value?

Generative AI enabling dynamically personalized quests, difficulty curves, and narrative branches can extend engagement windows for live-service titles beyond traditional content-drought churn points. Mid-sized live-service studios stand to benefit most, gaining retention tools previously available only to top-tier publishers with large content teams.

Can Regulated Esports Betting Integration Create New Revenue Streams?

Structured, compliance-first integration of skill-based wagering and fantasy formats around competitive titles offers a new monetization layer distinct from in-game purchases. Publishers holding major esports franchises are best positioned to capture this opportunity, provided they navigate jurisdiction-specific gambling regulation carefully.

Segmentation Analysis

Key Market Segments Evaluated

By Platform

  • Mobile
  • PC
  • Console
  • Cloud Gaming
  • Web and Emerging Platforms

By Game Genre

  • Action
  • Adventure
  • Role Playing Games
  • Strategy
  • Simulation
  • Sports
  • Shooter
  • Casual and Puzzle

By Business Model

  • Free to Play
  • Pay to Play
  • Subscription

By Distribution Channel

  • Console Stores
  • Mobile App Stores
  • PC Platforms
  • Cloud Services
  • Game Discs
  • Retail Sales

Which Platform Segment Dominates the Video Games Market?

2025 (USD Billion)
2035 (USD Billion)
Mobile 2025: $120.00 Billion | 2035: $296.40 Billion
Mobile
PC 2025: $66.00 Billion | 2035: $156.00 Billion
PC
Console 2025: $84.00 Billion | 2035: $187.20 Billion
Console
Cloud Gaming 2025: $15.00 Billion | 2035: $78.00 Billion
Cloud Gaming
Web and Emerging Platforms 2025: $15.00 Billion | 2035: $62.40 Billion
Web and Emer
Mobile $120.00 Billion $296.40 Billion 9.4%
PC $66.00 Billion $156.00 Billion 9.0%
Console $84.00 Billion $187.20 Billion 8.4%
Cloud Gaming $15.00 Billion $78.00 Billion 18.0%
Web and Emerging Platforms $15.00 Billion $62.40 Billion 15.3%

Mobile dominates the platform segmentation with an estimated USD 120.0 Billion in 2025, rising to USD 296.4 Billion by 2035, supported by low device costs and expansive app-store distribution. Cloud Gaming is the fastest-growing segment at a 18.0% CAGR, reflecting rapid data- center buildout and rising adoption of device-agnostic streaming among players who previously lacked access to premium console-grade titles.

Which Genre Leads and Which Is Growing Fastest?

2025 (USD Billion)
2035 (USD Billion)
Action 2025: $66.00 Billion | 2035: $163.80 Billion
Action
Adventure 2025: $24.00 Billion | 2035: $62.40 Billion
Adventure
Role Playing Games 2025: $48.00 Billion | 2035: $140.40 Billion
Role Playing
Strategy 2025: $24.00 Billion | 2035: $54.60 Billion
Strategy
Simulation 2025: $30.00 Billion | 2035: $78.00 Billion
Simulation
Sports 2025: $36.00 Billion | 2035: $85.80 Billion
Sports
Shooter 2025: $54.00 Billion | 2035: $132.60 Billion
Shooter
Casual and Puzzle 2025: $18.00 Billion | 2035: $62.40 Billion
Casual and P
Action $66.00 Billion $163.80 Billion 9.5%
Adventure $24.00 Billion $62.40 Billion 10.1%
Role Playing Games $48.00 Billion $140.40 Billion 11.3%
Strategy $24.00 Billion $54.60 Billion 8.6%
Simulation $30.00 Billion $78.00 Billion 10.1%
Sports $36.00 Billion $85.80 Billion 9.1%
Shooter $54.00 Billion $132.60 Billion 9.4%
Casual and Puzzle $18.00 Billion $62.40 Billion 13.2%

Action retains genre leadership with USD 66.0 Billion in 2025 revenue, reflecting broad cross-platform appeal and sustained franchise investment. Casual and Puzzle is the fastest-growing genre at a 13.2% CAGR, driven by low-commitment mobile play patterns among older adult and casual demographic segments that are newly entering the player base through smartphone accessibility.

Which Business Model Is Gaining the Most Ground?

2025 (USD Billion)
2035 (USD Billion)
Free to Play 2025: $174.00 Billion | 2035: $405.60 Billion
Free to Play
Pay to Play 2025: $81.00 Billion | 2035: $179.40 Billion
Pay to Play
Subscription 2025: $45.00 Billion | 2035: $195.00 Billion
Subscription
Free to Play $174.00 Billion $405.60 Billion 8.9%
Pay to Play $81.00 Billion $179.40 Billion 8.3%
Subscription $45.00 Billion $195.00 Billion 15.8%

Free to Play remains dominant with USD 174.0 Billion in 2025 revenue, anchored by in-game purchase monetization across mobile titles. Subscription is the fastest-growing model at a 15.8% CAGR as platform holders bundle catalog access into recurring fees, a shift that our analysis shows is stabilizing publisher revenue against individual title performance volatility.

2025 (USD Billion)
2035 (USD Billion)
Category A
Category B
Category C
Category D
Segment Item 2025 (USD Billion) 2035 (USD Billion) CAGR
Category A $10.0 USD Billion $40.0 USD Billion 17.0%
Category B $17.1 USD Billion $51.1 USD Billion 27.0%
Category C $24.2 USD Billion $62.2 USD Billion 9.0%
Category D $31.3 USD Billion $73.3 USD Billion 19.0%

Segment-wise data not detailed in this view

Unlock complete segment-wise numbers for By Age Group.

Unlock Full Data

2025 (USD Billion)
2035 (USD Billion)
Console Stor
Mobile App S
PC Platforms
Cloud Servic
Game Discs
Segment Item 2025 (USD Billion) 2035 (USD Billion) CAGR
Console Stores $10.0 USD Billion $40.0 USD Billion 25.0%
Mobile App Stores $17.1 USD Billion $51.1 USD Billion 19.0%
PC Platforms $24.2 USD Billion $62.2 USD Billion 25.0%
Cloud Services $31.3 USD Billion $73.3 USD Billion 19.0%
Game Discs $38.4 USD Billion $84.4 USD Billion 20.0%

Segment-wise data not detailed in this view

Unlock complete segment-wise numbers for By Distribution Channel.

Unlock Full Data

SWOT Analysis

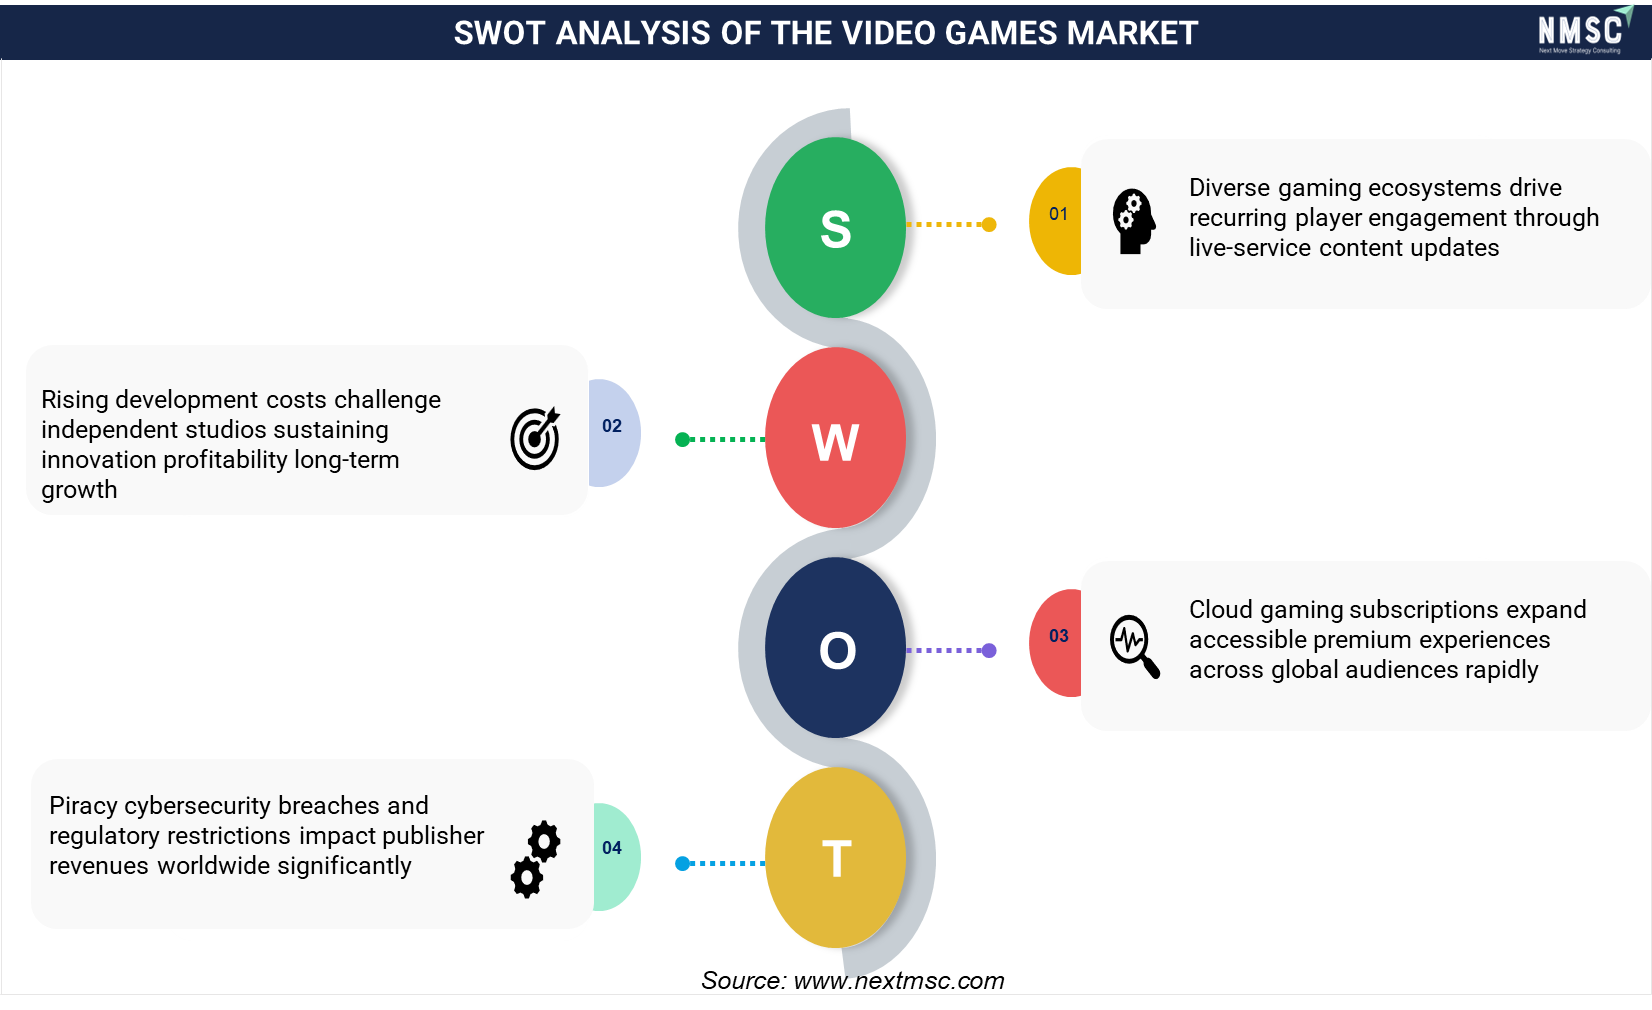
This SWOT view highlights structural strengths, strategic gaps, expansion headroom, and external risks shaping outcomes in the Video Games Market Global Industry Analysis and Forecast (2026-2035).

Strengths

Diverse gaming ecosystems drive recurring player engagement through live-service content updates

Weaknesses

Rising development costs challenge independent studios sustaining innovation profitability long-term growth

Opportunities

Cloud gaming subscriptions expand accessible premium experiences across global audiences rapidly

Threats

Piracy cybersecurity breaches and regulatory restrictions impact publisher revenues worldwide significantly

Regional Outlook

North America $75.00 Billion $156.00 Billion 7.6%
Europe $54.00 Billion $117.00 Billion 8.0%
Asia-Pacific $135.00 Billion $327.60 Billion 9.3%
Middle East & Africa $15.00 Billion $78.00 Billion 18.0%
Latin America $21.00 Billion $101.40 Billion 17.0%

Competitive Landscape

How Do Companies Compete in the Video Games Market?

Companies compete primarily on exclusive content pipelines, platform ecosystem lock-in, and monetization sophistication. Our analysis shows that publishers with owned intellectual property across multiple genres sustain revenue more reliably than single-franchise competitors, particularly as player acquisition costs rise across saturated mobile app-store environments.

Which Competitive Archetypes Dominate the Industry?

Two archetypes dominate: platform-holder conglomerates that combine hardware, storefronts, and first-party studios, and diversified free-to-play publishers built on live-service mobile titles. We observed that the differentiation between these archetypes is narrowing as platform holders expand subscription catalogs and free-to-play publishers invest in premium console-adjacent titles.

What Innovation and Differentiation Strategies Are Companies Pursuing?

Company analysis indicates that leading firms are differentiating through generative AI-assisted content pipelines, cross-platform save synchronization, and cloud-native title design. Investment in proprietary game engines and middleware continues, alongside expanded regional data- center partnerships to reduce cloud-streaming latency in underserved markets.

How Active Is M&A in the Video Games Industry?

M&A activity remains elevated as diversified conglomerates acquire studios to secure exclusive franchises and reduce reliance on third-party licensing. Based on research conducted by Next Move Strategy Consulting, we found that acquisition targets increasingly include mobile-first and casual studios, reflecting strategic pivots toward the fastest-growing platform segment.

Competitive Dynamics and M&A Landscape

Recent strategic moves, partnerships, and acquisitions shaping the Video Games Market Global Industry Analysis and Forecast (2026-2035).

February 2024 Epic Games and The Walt Disney Company Collaboration, Investment Epic Games and The Walt Disney Company announced a multiyear collaboration to create a persistent games and entertainment universe connected with Fortnite. Disney also committed to invest USD 1.5 billion for an equity stake in Epic Games. The partnership expands opportunities for immersive gaming experiences using Unreal Engine and is one of the largest strategic investments in the video game industry in recent years.

Key Market Players

Sony Interactive Entertainment LLC Tencent Holdings Limited Microsoft Corporation Nintendo Co., Ltd. NetEase, Inc. Electronic Arts Inc. Epic Games, Inc. Take-Two Interactive Software, Inc. COGNOSPHERE PTE. LTD. ( HoYoverse ) Roblox Corporation Nexon Co., Ltd. Embracer Group AB Square Enix Holdings Co., Ltd. Bandai Namco Holdings Inc. Ubisoft Entertainment SA

Investment Opportunities

Where Is Capital Flowing Within the Video Games Market?

Capital inflows are concentrated in live-service studio acquisitions, cloud-infrastructure partnerships, and mobile-first publisher stakes. We found that sovereign wealth funds, notably from Gulf states, have taken direct equity positions in major publishers, signaling long-horizon strategic capital alongside traditional private equity and venture funding.

How Significant Is Infrastructure Investment in This Market?

Infrastructure investment is substantial, with data- center buildouts supporting low-latency cloud streaming representing a growing share of publisher and platform-holder capital expenditure. Our assessment indicates that regional edge-server expansion in Asia-Pacific and the Middle East is a prerequisite for cloud-gaming adoption to scale beyond currently connected markets.

What ESG Considerations Are Relevant to This Market?

ESG considerations center on labor practices within development studios, data privacy protections for minor users, and energy consumption tied to cloud-streaming data centers. We observed that publishers increasingly disclose crunch-reduction and workplace-wellness initiatives in annual sustainability reporting, alongside growing energy-efficiency commitments for server infrastructure.

Key Benefits for Stakeholders

How Does This Report Benefit Industry Leaders?

Industry and enterprise leaders gain a structured view of platform, genre, and regional revenue distribution, supporting prioritization decisions across content investment and platform partnership strategy. Our analysis shows that this structured segmentation clarifies where competitive intensity is rising fastest ahead of resource-allocation decisions.

How Does This Report Benefit Investors and Financial Analysts?

Investors and financial analysts gain reconciled market-size, CAGR, and regional-growth data supporting valuation and portfolio-allocation decisions. Company analysis indicates that segment-level growth differentials, particularly around subscription and cloud gaming, are material inputs for evaluating publisher and platform-holder growth durability.

How Does This Report Benefit Technology Vendors and Product Teams?

Technology vendors and product teams gain visibility into platform and distribution-channel trends shaping infrastructure demand, including cloud-streaming and cross-platform requirements. We found that this analysis supports prioritization of engineering investment toward the fastest-growing technical delivery mechanisms identified across the forecast period.

Conclusion & Recommendations

The long-term outlook remains firmly expansionary, with revenue projected to more than double from USD 332.0 Billion in 2026 to USD 780.0 Billion by 2035 at a 9.9% CAGR. Our analysis shows that this trajectory is underpinned by structural shifts toward subscription and cloud-delivered access rather than cyclical hit-driven demand alone.

What Strategic Positioning Should Companies Pursue?

Companies should prioritize cross-platform catalog breadth and subscription bundling over single-title dependency. We found that publishers diversifying across genres and platforms sustain more predictable revenue than those reliant on individual blockbuster releases, particularly as player acquisition costs continue rising across mobile channels.

How Attractive Is the Market for Investment?

Investment attractiveness is high given double-digit growth in cloud gaming and subscription segments alongside a large, maturing installed base. Our assessment indicates that capital allocators should weight exposure toward platform holders and studios with proven live-service retention metrics over unproven single-title developers.

What Market Shifts and Key Risks Should Stakeholders Monitor?

Key risks include tightening loot-box and minor-protection regulation across Europe and South Korea, rising piracy in price-sensitive markets, and hardware upgrade cost sensitivity constraining premium console adoption. We observed that regulatory shifts pose the most immediate near-term risk to free-to-play monetization design.

What Are the Primary Growth Pathways Through 2035?

Primary growth pathways include cloud-streaming expansion into underserved geographies, AI-personalized live-service content extending player lifetime value, and structured esports monetization. Our findings suggest that companies combining all three pathways will outpace single-lever competitors through the forecast period.

About the Author

Author

Sikha Haritwal is an assistant manager with strong expertise in market research, data analysis, and cross-functional coordination. She plays a key role in leading complex research initiatives, strengthening analytical rigor, and enabling data-driven decision-making across teams. Known for her leadership mindset and structured problem-solving approach, she supports process improvement, enhances operational efficiency, and contributes to building scalable frameworks that drive long-term strategic outcomes and organizational effectiveness.

About the Reviewer

Reviewer

Supradip Baul is an accomplished business consultant and strategist with over a decade of rich experience in market intelligence, strategy, technology, and business transformation. His work has included rigorous qualitative and quantitative analysis across multiple industries, helping clients shape investment decisions and long-term roadmaps. Earlier in his career, he was associated with Gartner, where he contributed to industry-leading reports and market share analyses. He has worked with leading global companies and holds an MBA with a dual specialization in Marketing and Finance.

Download Free Sample

FAQs

Diana Trejo

DIANA TREJO

Assistant Manager

Sumitomo Corporation de Mexico, S.A. de C.V.

Recently, we purchased a report on the Mexico Data Center Market from Next Move Strategy Consulting. The service has been excellent, with support that is always timely and thoroughly professional. The information provided is interesting, highly useful, and delivered with clarity. I would highly recommend NextMSC for anyone seeking insightful and dependable analysis.

Semih Kavaklioglu

SEMIH KAVAKLIOGLU

Co-Founder & Sales Manager

Decortie

I work a lot in the marketing industry and I know that research is an essential part of any campaign. I have used Market research reports for my own products and I found them to be very informative and well-researched. The team here produces insightful reports for a good price

Henri Knyphausen

HENRI KNYPHAUSEN

Partner at Singulier [Ex-BCG]

Singulier

I recently engaged NEXTMSC.com for a commercial due diligence project within the intralogistics sector, and I am pleased to provide a reference based on my experience. In utilizing NEXTMSC.com's services, I found their report to offer valuable insights into market dynamics and key industry players. The initial report provided a solid foundation for our analysis. However, as we were investigating a smaller target in the market, and I had specific customization requests requiring additional research. These requests included detailed information on product portfolios of various players and sub-market sizes, both inclusive and exclusive of certain product categories. NEXTMSC.com demonstrated commendable responsiveness and agility in accommodating these customization requests. Within a timeframe of 1-2 weeks, they delivered a revised report that met our specific needs. Furthermore, they were receptive to my follow-up inquiries, ensuring clarity and understanding of the data provided. The final deliverable significantly contributed to our due diligence efforts. One of NEXTMSC.com's notable strengths lies in their qualitative research capabilities. However, for future engagements, I would recommend the inclusion of a quantified market model in Excel format. Such a model would offer the ability to conduct in-depth analyses and explore various market segments, including country-specific data and subcomponent breakdowns. Based on my positive experience, I would not hesitate to work with NEXTMSC.com again. Their responsiveness, willingness to accommodate customization requests, and commitment to delivering actionable insights make them a reliable partner for commercial research projects.

Pratyush Kumar Das

PRATYUSH KUMAR DAS

Assistant Manager

Polycab India Limited

We would like to express our appreciation for the data and insights provided by nextmsc. We are very pleased with the quality and depth of the information, which has proven to be highly valuable and beneficial for our business decision-making.

Kishu Kanda

KISHU KANDA

Strategy Analyst

Accenture

We purchased the AI Consumer Market Report from this company. Not only did they customize the report to meet our specific requirements, but they also showed great flexibility in accommodating our budget. The report we received fully met our expectations. Additionally, they provided prompt and thorough responses to both our pre-purchase and follow-up questions. We look forward to working with this company again in the future.

Custom Market Research Services

We will customize the research for you if the listed report does not fully match your requirements.

Get 30% Free Customization

Select License

This website uses cookies to ensure you get the best experience on our website. Learn more