Water Treatment Market

Water Treatment Market size was USD 391.01 Billion in 2025, projected to reach USD 806.63 Billion by 2035, growing at a CAGR of 7.51% from 2026 to 2035. Key drivers include tightening discharge quality regulations, rising investment in water reuse and reclamation, and increasing demand for treatment infrastructure upgrades, with Asia-Pacific leading the market.

Download Free Sample PDF
Base Year (2025)
$391.01 Billion
Forecast (2035)
$806.63 Billion
CAGR (2026-2035)
7.5%
Top Country
Asia-Pacific

What Is the Water Treatment Market Size?

The Water Treatment Market size was valued at USD 391.01 billion in 2025. It is estimated at USD 420.37 billion in 2026. Themarket is forecast to reach USD 806.63 billion by 2035. It expands at a 7.51% CAGR between 2026 and 2035. Asia-Pacific leads with approximately a 34% share. Equipment & Systems dominates with approximately a 46% share.

Growth in the market is broad-based. Every segmentation axis shows measurable gains. Treatment Services and industrial water reuse are driving the fastest structural shifts. Tightening discharge regulations and water scarcity are reshaping technology selection through 2035.

Water Treatment Market Revenue Forecast

Values in USD Billion

2025 $391.01 Billion
2025
2026 $420.37 Billion
2026
2027 $451.94 Billion
2027
2028 $485.88 Billion
2028
2029 $522.37 Billion
2029
2030 $561.60 Billion
2030
2031 $603.78 Billion
2031
2032 $649.12 Billion
2032
2033 $697.87 Billion
2033
2034 $750.28 Billion
2034
2035 $806.63 Billion
2035

Key Takeaways

By Offering: Equipment & Systems held the largest share of approximately 46% (USD 179.87 billion) in 2025; Treatment Services is the fastest-growing sub-segment at 8.6% CAGR from 2026–2035.

By Application: Municipal Wastewater Treatment held the largest share of approximately 22% (USD 86.02 billion) in 2025; Water Reuse and Recycling is the fastest-growing sub-segment at 9.5% CAGR from 2026–2035.

By Technology: Membrane Treatment held the largest share of approximately 24% (USD 93.84 billion) in 2025; Advanced Oxidation is the fastest-growing sub-segment at 9.2% CAGR from 2026–2035.

By End-Use Industry: Municipal & Public Utilities held the largest share of approximately 40% (USD 156.40 billion) in 2025; Industrial is the fastest-growing sub-segment at 8.0% CAGR from 2026–2035.

By Sales Channel: Direct Sales held the largest share of approximately 48% (USD 187.69 billion) in 2025; Retail and E-Commerce is the fastest-growing sub-segment at 8.9% CAGR from 2026–2035.

Dominant Region: Asia-Pacific dominated with approximately 34% revenue share (USD 132.94 billion) in 2025.

Fastest-Growing Region: Middle East & Africa is expected to register the highest CAGR of 9.3% during 2026–2035.

Dominant Country: The U.S. led with approximately USD 73.20 billion in 2025.

Fastest-Growing Country: India is the fastest-growing country at approximately 10.5% CAGR from 2026–2035.

Market Opportunity: The Water Treatment Market is expected to create an absolute dollar opportunity of USD 386.26 billion between 2026 and 2035. This presents significant investment potential across membrane, chemical, and outsourced treatment service value chains.

According to NMSC analysis, water treatment operators are increasingly bundling equipment sales with long-term operation and maintenance contracts rather than one-time hardware sales. This shift is broadening recurring revenue streams and reshaping vendor competitive positioning across the industry through 2035.

Ecosystem Analysis of the Water Treatment Industry

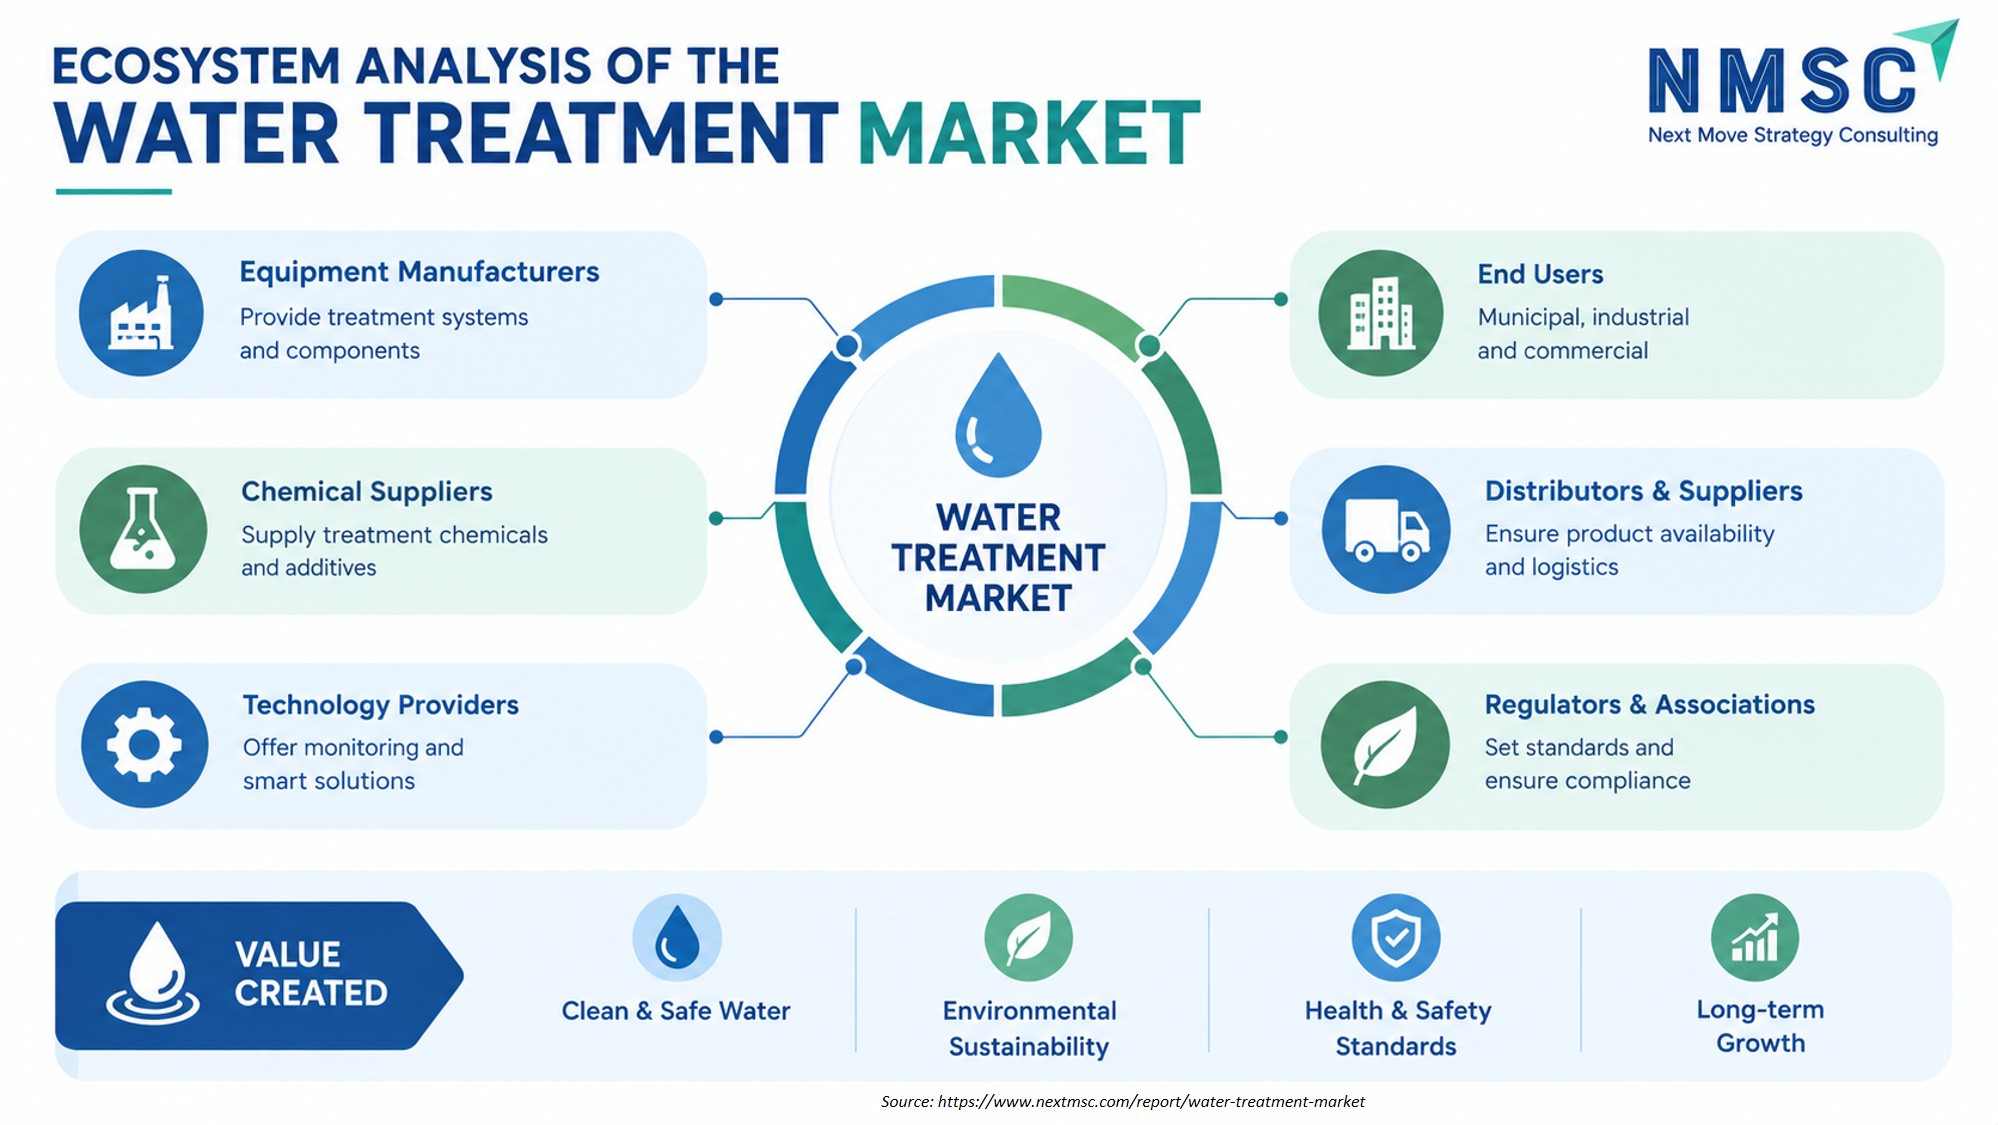
The above infographic presents the water treatment market as a connected ecosystem, linking equipment manufacturers, chemical suppliers, technology providers, distributors, end users, and regulators. It shows how these participants support treatment solutions while creating value through clean and safe water, environmental sustainability, health and safety compliance, and long-term market growth .

What Does the Water Treatment Market Encompass?

This market covers equipment, chemicals, and services that remove contaminants from water for drinking, industrial process, and wastewater discharge purposes. The scope spans standalone treatment equipment, packaged and modular treatment plants, coagulants and biocides, and engineering, construction, and operation services. The category has moved from single-purpose treatment units toward integrated, multi-technology plants. These systems combine physical, chemical, biological, and membrane treatment stages within one facility.

Discharge quality standards and drinking water regulations set by national environmental agencies shape equipment specifications and chemical dosing requirements worldwide. Utilities and industrial operators increasingly favor digitally monitored systems that reduce chemical consumption and energy use. We observed that smart water monitoring platforms are becoming standard on new municipal and industrial installations. NMSC's analysis indicates that this digital shift is redefining competitive positioning across the market .

Market Drivers & Dynamics

Interactive Dataset
Tightening municipal and industrial discharge quality regulations driver +1.9% Global 2026-2035
Rising water scarcity driving reuse and recycling investment driver +1.5% Middle East & Africa, Asia-Pacific 2026-2035
Growing demand from semiconductor and data center industries driver +1.2% North America, Asia-Pacific 2026-2033
Expansion of outsourced operation and maintenance contracts driver +1.0% Global 2026-2035
Adoption of digital monitoring and AI-based dosing optimization driver +0.7% North America, Europe 2026-2032
Growing desalination investment in water-stressed economies driver +0.5% Middle East & Africa 2026-2033
High capital cost of advanced membrane and thermal treatment systems restraint -1.3% Global 2026-2032
Energy-intensive nature of reverse osmosis and thermal desalination restraint -0.9% Middle East & Africa, Asia-Pacific 2026-2031
Fragmented local permitting and procurement processes restraint -0.6% Latin America, Middle East & Africa 2026-2030
Chemical price volatility tied to feedstock cost swings restraint -0.4% Global 2026-2033
Source: Next Move Strategy Consulting

Growth Drivers

What Is the Primary Growth Driver of the Water Treatment Market?

Tightening discharge quality regulations are the primary driver of the market . National environmental agencies continue to lower permissible contaminant thresholds for both municipal and industrial dischargers. We observed that this regulatory pressure anchors baseline capital spending on new treatment capacity. It also drives retrofit demand across aging municipal infrastructure that no longer meets current discharge standards.

How Is Water Reuse Investment Driving Market Growth?

Water reuse investment is accelerating growth across the industry. Veolia's Water Technologies division reported 3.6% revenue growth in 2025, driven partly by contracts tied to industrial reuse and reclamation. NMSC's analysis indicates that water-scarce regions are treating reclaimed water as core infrastructure rather than an optional add-on. This shift is compressing the sales cycle for reuse-linked treatment technology.

Growth Inhibitors

What Is Restraining Water Treatment Market Expansion?

High capital cost restrains broader market expansion, particularly for advanced membrane and thermal desalination systems. These technologies require larger upfront investment than conventional biological or chemical treatment. We found that energy-intensive reverse osmosis and thermal processes further constrain adoption in regions with high electricity costs. This pushes some operators toward lower-cost, lower-recovery treatment alternatives instead.

Segmentation Analysis

2025 (USD Billion)
2035 (USD Billion)
Standalone E
Pretreatment
Filtration E
Membrane Equ
Ion Exchange
Segment Item 2025 (USD Billion) 2035 (USD Billion) CAGR
Standalone Equipment $10.0 USD Billion $40.0 USD Billion 14.0%
Pretreatment and Solids Separation $17.1 USD Billion $51.1 USD Billion 8.0%
Filtration Equipment $24.2 USD Billion $62.2 USD Billion 14.0%
Membrane Equipment $31.3 USD Billion $73.3 USD Billion 20.0%
Ion Exchange Equipment $38.4 USD Billion $84.4 USD Billion 27.0%

Segment-wise data is locked

Unlock complete segment-wise numbers for Offering.

Unlock Full Data

Which Offering Dominates the Water Treatment Market?

Equipment & Systems led the Water Treatment Market with USD 179.87 billion in 2025. Standalone equipment and packaged treatment plants remain the largest single spending category for both municipal and industrial buyers. Treatment Services is the fastest-growing offering. It expands at an 8.6% CAGR from 2026 to 2035. Operators increasingly outsource operation and maintenance work rather than building in-house technical teams, and this shift is fueling service revenue growth across the market .

2025 (USD Billion)
2035 (USD Billion)
Drinking Wat
Municipal Wa
Industrial W
Industrial P
Industrial U
Segment Item 2025 (USD Billion) 2035 (USD Billion) CAGR
Drinking Water Treatment $10.0 USD Billion $40.0 USD Billion 25.0%
Municipal Wastewater Treatment $17.1 USD Billion $51.1 USD Billion 11.0%
Industrial Wastewater Treatment $24.2 USD Billion $62.2 USD Billion 25.0%
Industrial Process Water Treatment $31.3 USD Billion $73.3 USD Billion 11.0%
Industrial Utility Water Treatment $38.4 USD Billion $84.4 USD Billion 16.0%

Segment-wise data is locked

Unlock complete segment-wise numbers for Application.

Unlock Full Data

Which Application Leads Water Treatment Market Demand?

Municipal Wastewater Treatment remained the leading application, valued at USD 86.02 billion in 2025. Every city needs wastewater treatment capacity, which makes this the broadest and most consistent demand source in the market . Water Reuse and Recycling is the fastest-growing application. It expands at a 9.5% CAGR from 2026 to 2035, as water-stressed regions treat reclaimed water as core infrastructure rather than a supplemental resource.

2025 (USD Billion)
2035 (USD Billion)
Physical Tre
Screening
Grit Removal
Sedimentatio
Clarificatio
Segment Item 2025 (USD Billion) 2035 (USD Billion) CAGR
Physical Treatment $10.0 USD Billion $40.0 USD Billion 27.0%
Screening $17.1 USD Billion $51.1 USD Billion 9.0%
Grit Removal $24.2 USD Billion $62.2 USD Billion 19.0%
Sedimentation $31.3 USD Billion $73.3 USD Billion 17.0%
Clarification $38.4 USD Billion $84.4 USD Billion 18.0%

Segment-wise data is locked

Unlock complete segment-wise numbers for Technology.

Unlock Full Data
2025 (USD Billion)
2035 (USD Billion)
Municipal &
Residential
Industrial
Chemicals &
Oil & Gas
Segment Item 2025 (USD Billion) 2035 (USD Billion) CAGR
Municipal & Public Utilities $10.0 USD Billion $40.0 USD Billion 14.0%
Residential & Commercial $17.1 USD Billion $51.1 USD Billion 24.0%
Industrial $24.2 USD Billion $62.2 USD Billion 22.0%
Chemicals & Petrochemicals $31.3 USD Billion $73.3 USD Billion 12.0%
Oil & Gas $38.4 USD Billion $84.4 USD Billion 27.0%

Segment-wise data is locked

Unlock complete segment-wise numbers for End-Use Industry.

Unlock Full Data

Which End-Use Industry Leads Water Treatment Market Demand?

Municipal & Public Utilities remained dominant, valued at USD 156.40 billion in 2025. Public sector treatment plants and distribution networks represent the single largest buyer category across the industry. Industrial is the fastest-growing end-use industry. It expands at an 8.0% CAGR from 2026 to 2035, as chemicals, semiconductor, and power generation facilities scale up process and reuse water treatment capacity to meet tightening discharge and purity requirements.
2025 (USD Billion)
2035 (USD Billion)
Direct Sales
Distributor
OEM and Syst
Retail and E
Other Sales
Segment Item 2025 (USD Billion) 2035 (USD Billion) CAGR
Direct Sales $10.0 USD Billion $40.0 USD Billion 24.0%
Distributor and Dealer $17.1 USD Billion $51.1 USD Billion 22.0%
OEM and System Integrator $24.2 USD Billion $62.2 USD Billion 20.0%
Retail and E-Commerce $31.3 USD Billion $73.3 USD Billion 22.0%
Other Sales Channels $38.4 USD Billion $84.4 USD Billion 13.0%

Segment-wise data is locked

Unlock complete segment-wise numbers for Sales Channel.

Unlock Full Data

Growth Opportunities

Our analysis shows that three forward-looking opportunities stand out within this market over the 2026-2035 forecast period.

How Can Outsourced Operations Unlock Value for Water Treatment Providers?

Outsourced operations and maintenance contracts present a whitespace opportunity for providers seeking recurring, predictable revenue. Providers that build dedicated remote monitoring and staffing capability can capture long-term municipal and industrial contracts, benefiting the Treatment Services offering segment as utilities shift technical staffing risk onto specialized operators.

Where Does Semiconductor-Grade Water Treatment Create New Demand?

Semiconductor and data center water purity requirements create an underpenetrated opportunity for specialized treatment providers. Providers that scale ultrapure water and sulfate-removal capability can capture premium contract value, benefiting the Industrial Process Water Treatment application segment as fabrication capacity expands across multiple regions.

How Can Water Reuse Infrastructure Benefit Water-Stressed Markets?

Water reuse and recycling infrastructure presents an opportunity for providers targeting water-stressed regions seeking reliable, non-freshwater supply sources. Providers that scale advanced reclamation capability can capture new municipal and industrial contract revenue, benefiting the Water Reuse and Recycling application segment as scarcity pressure continues to expand this category faster than the broader market.

Regional Outlook

2025 (USD Billion)
2035 (USD Billion)
Asia-Pacific
North Americ
Europe
Middle East
Latin Americ
Region 2025 (USD Billion) 2035 (USD Billion) CAGR (%)
Asia-Pacific $10.0 USD Billion $40.0 USD Billion 9.0%
North America $17.1 USD Billion $51.1 USD Billion 27.0%
Europe $24.2 USD Billion $62.2 USD Billion 25.0%
Middle East & Africa $31.3 USD Billion $73.3 USD Billion 23.0%
Latin America $38.4 USD Billion $84.4 USD Billion 12.0%

Regional data is locked

Unlock complete regional numbers for this market.

Unlock Full Data

Regulatory Framework Impacting the Water Treatment Industry

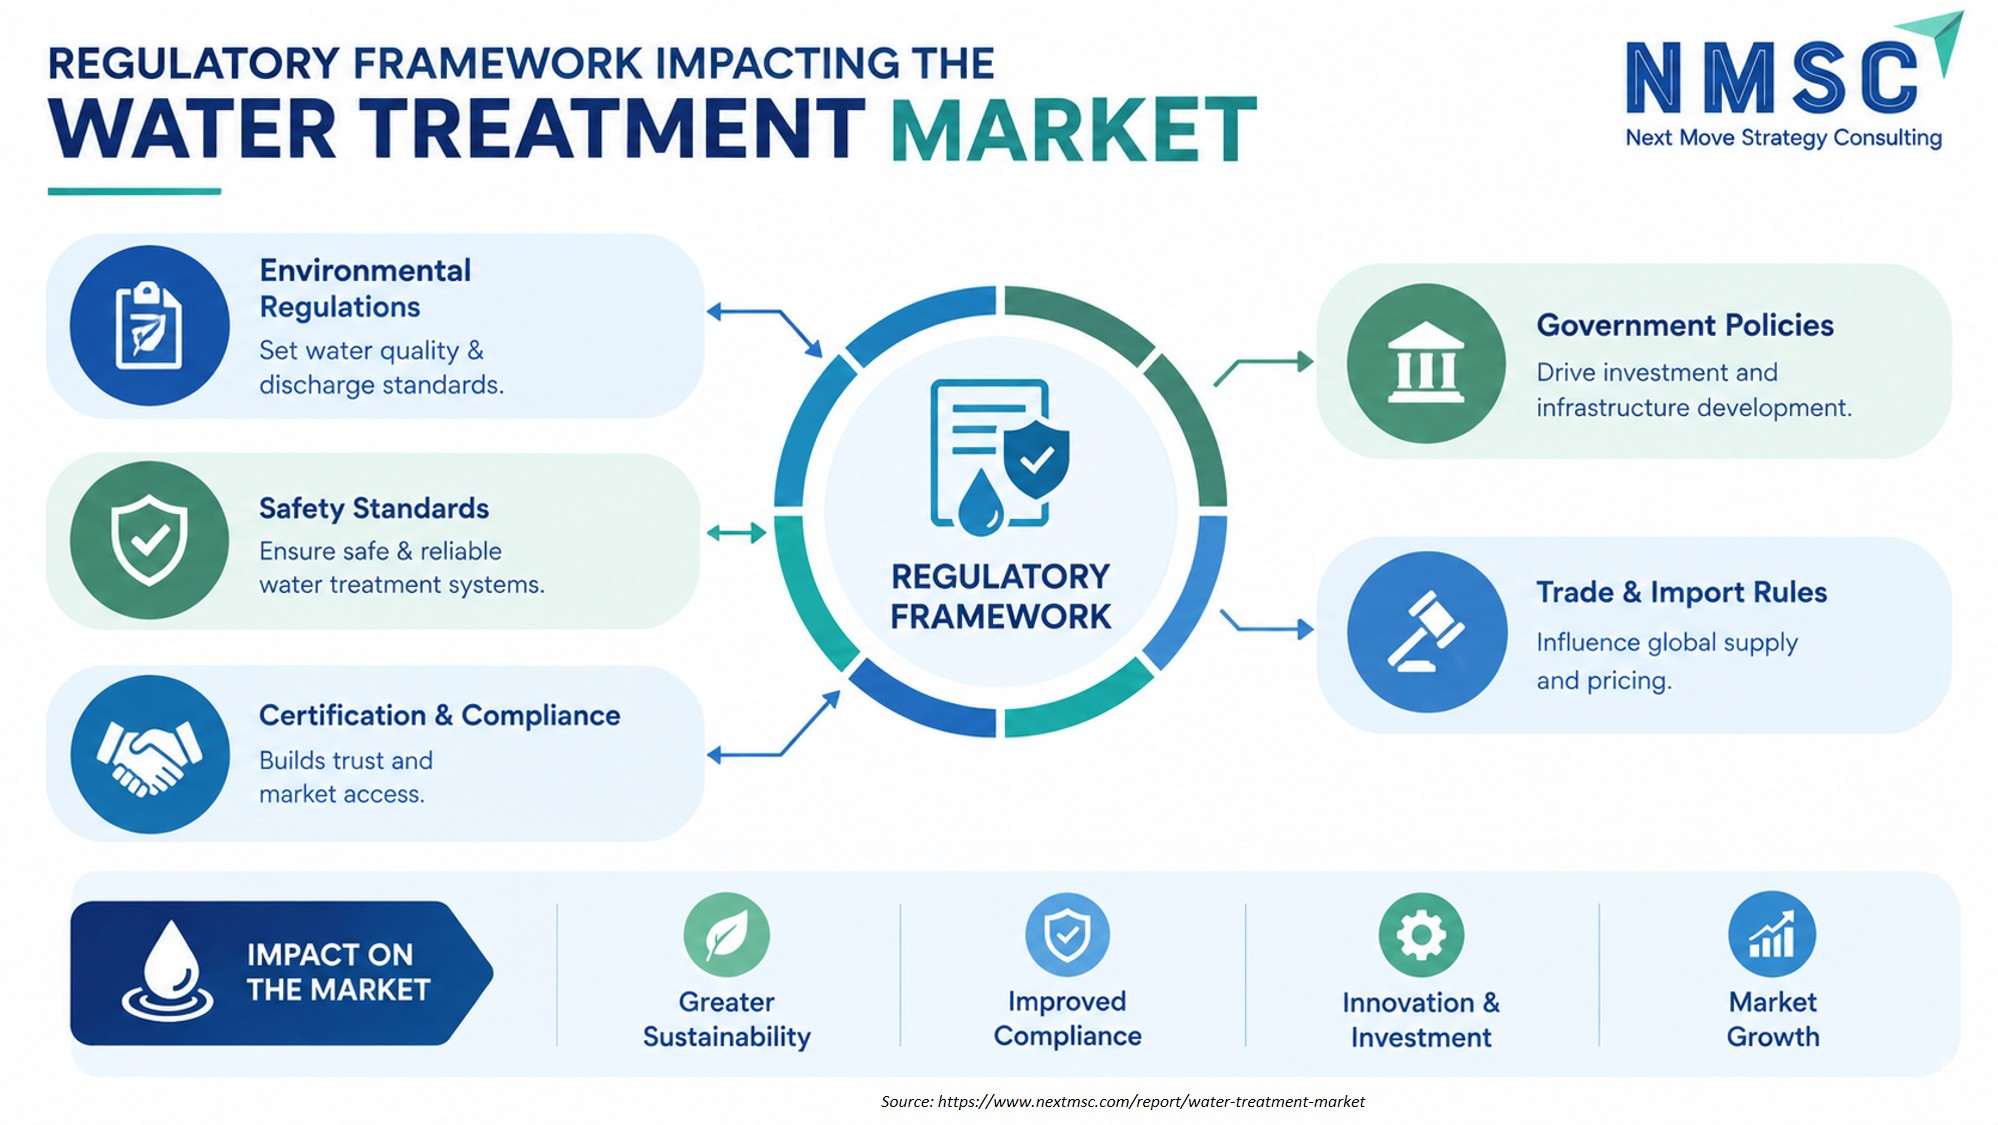
The above infographic illustrates how regulatory frameworks influence the water treatment market through environmental regulations, safety standards, certification requirements, government policies, and trade rules. These factors collectively shape compliance, market access, investment, technology adoption, and operational practices, ultimately supporting greater sustainability, improved standards, innovation, and long-term market growth .

Competitive Landscape

We observed that the industry features a mix of diversified global providers, specialized chemical manufacturers, and regional equipment suppliers competing across technology depth, service breadth, and geographic reach. Field | Details Market Structure | Moderately consolidated among diversified global providers, with fragmented regional competition among specialized equipment and chemical manufacturers. Innovation Focus | Digital monitoring, membrane technology advances, and outsourced operation and maintenance models dominate current innovation pipelines across leading providers. M&A Activity | Large-scale consolidation, exemplified by Veolia's completed integration of Suez in 2025, creating an expanded global platform across water, waste, and energy services. Source: www.nextmsc.com

How Do Companies Compete in the Water Treatment Market?

Companies compete primarily on technology breadth, service delivery capability, and geographic reach across the industry. Diversified providers such as Veolia and Xylem leverage integrated equipment, chemical, and service portfolios to serve large municipal and industrial contracts, while specialized manufacturers such as SNF and Kemira compete on chemical formulation depth for specific treatment applications.

Which Competitive Archetypes Dominate the Water Treatment Industry?

Two archetypes dominate this market: diversified global providers offering integrated equipment, chemical, and service portfolios, and specialized manufacturers focused on specific technology or chemical categories. Veolia and Xylem exemplify the diversified archetype through broad multi-country platforms, while SNF and Kurita Water Industries exemplify the specialized archetype through deep chemical and technology expertise.

How Are Companies Differentiating Through Innovation in the Market?

Innovation and differentiation strategy increasingly center on digital monitoring and outsourced service models. Veolia's reported 23% share of efficiency gains from digital and AI initiatives illustrates how providers are pairing traditional treatment technology with measurable digital performance gains. Providers unable to demonstrate this digital capability risk losing contracts to competitors offering integrated, data-driven service models.

What M&A and Expansion Activity Is Shaping the Market?

Consolidation and strategic partnerships continue to shape competitive positioning within the industry. Veolia's completed Suez integration created a combined entity with expanded geographic reach and technology depth, while its collaboration with carbon-removal firm Capture6 illustrates how providers are pairing water treatment with adjacent climate technology to serve broader industrial client needs.

Key Market Players

Our assessment indicates that the following 20 companies are actively shaping technology innovation, service delivery, and competitive strategy within the global industry.

Ecolab Inc. Veolia Environnement S.A. Xylem Inc. SNF SAS Solenis LLC SUEZ S.A. Kurita Water Industries Ltd. DuPont de Nemours, Inc. Pentair plc Kemira Oyj Saur SAS Toray Industries, Inc. Grundfos Holding A/S ORGANO CORPORATION Alfa Laval AB VA Tech Wabag Limited Thermax Limited Industrie De Nora S.p.A. Doosan Enerbility Co., Ltd. Ovivo Inc.

Latest Developments

We found that recent contract wins and strategic developments within this market are concentrated on consolidation, digital efficiency, and high-purity industrial demand.

Date Event
July 2026 Kemira completed the acquisition of ANMAC Water Treatment Service and related assets in California. The transaction strengthens Kemira’s North American position in water-treatment services, adding customer contracts and capabilities for corrosion protection in large residential and commercial facilities.
February 2026 Veolia secured two 15-year O&M contracts for Mumbai’s largest and most critical water-treatment plants, with a combined capacity of 2,910 MLD. The projects deploy advanced technologies and strengthen long-term water security for one of India’s largest urban populations.
September 2025 Kurita partnered with FREDsense to deploy the FRED-PFAS field-analysis kit within Kurita’s water-treatment systems, with plans to scale adoption across additional applications. The collaboration integrates rapid PFAS concentration analysis with treatment-system deployment and monitoring.

Expert Insights

Christophe Beck

Christophe Beck

chairman and CEO | Ecolab

"The rapid acceleration of AI technology is increasing demands on our water and energy resources, yet it also offers unprecedented opportunity to address the water crisis through proprietary connected systems and powerful insights . By leveraging AI to reduce, reuse and repurpose water throughout business operations, we can continue to win the right way by delivering positive performance for customers while protecting natural resources."

Analyst Interpretation

Thestatement highlights the accelerating shift toward water reuse, recycling, and digitally enabled treatment solutions as water scarcity and resource-intensive industrial activities increase demand for efficient water management. Next Move Strategy Consulting’s analysis indicates that AI-enabled monitoring, connected treatment systems, and circular water-management technologies are becoming increasingly important across municipal and industrial applications. Our findings suggest that providers combining advanced treatment technologies with real-time monitoring, water reuse, and resource-efficient solutions will be well positioned to capture demand as industries and utilities prioritize water security, operational efficiency, and sustainability through 2035 .

Investment Opportunities

What Capital Inflows Are Targeting the Water Treatment Market?

Capital inflows into the market are increasingly directed toward consolidation and high-purity industrial capacity. Veolia's completed Suez integration illustrates the scale of capital committed to platform consolidation. We observed that investors favor providers demonstrating validated digital efficiency gains, viewing measurable operational savings as a proxy for durable margin performance.

How Is Infrastructure Investment Supporting the Market?

Infrastructure investment is expanding treatment capacity to meet rising municipal and industrial demand. Veolia's Q1 2025 semiconductor and energy contract wins illustrate how providers are investing in high-purity water infrastructure to serve advanced manufacturing clients, while continued desalination investment across the Middle East reflects similar infrastructure commitment across the industry.

What ESG Considerations Are Shaping Market Investment Decisions?

Environmental, social, and governance considerations increasingly shape investment decisions, with energy efficiency and water reuse as key criteria. Veolia's collaboration with Capture6 to pair water reclamation with carbon removal illustrates how providers are linking water treatment to broader climate goals. We found that investors increasingly favor providers demonstrating measurable resource efficiency, treating this as a differentiator alongside growth metrics.

Key Benefits for Stakeholders

How Does This Report Benefit Enterprise and Industry Leaders?

Enterprise and industry leaders gain access to validated segmentation, competitive benchmarking, and regional demand forecasts that support investment and product portfolio decisions across the industry. Our analysis shows that detailed offering, application, and technology breakdowns help providers align capacity planning with the fastest-growing demand areas, including treatment services and water reuse.

How Does This Report Benefit Investors and Financial Analysts?

Investors and financial analysts benefit from consistent, single-point market size and CAGR estimates that support valuation and capital-allocation decisions across this market supply chain. We observed that the report's regional and segment-level growth differentials help identify which providers and technology categories are best positioned to capture above-market growth in Middle East & Africa and Treatment Services categories through 2035.

How Does This Report Benefit Technology Vendors and Product Teams?

Technology vendors and product teams gain insight into emerging design requirements, including digital monitoring integration, membrane technology advances, and outsourced service delivery models, that are reshaping the market . Our findings suggest that this analysis helps R&D teams prioritize development roadmaps around energy efficiency and measurable operational performance increasingly required by municipal and industrial procurement criteria.

Key Market Segments Evaluated

Offering

  • Equipment & Systems
  • Treatment Chemicals
  • Treatment Services

Application

  • Municipal Wastewater Treatment
  • Drinking Water Treatment
  • Industrial Wastewater Treatment
  • Industrial Process Water Treatment
  • Water Reuse and Recycling
  • Industrial Utility Water Treatment
  • Residential Water Treatment
  • Saline Water Treatment
  • Residuals Treatment
  • Other Water Treatment Applications

Technology

  • Physical Treatment
  • Screening
  • Grit Removal
  • Sedimentation
  • Clarification
  • Flotation
  • Media Filtration
  • Cartridge Filtration
  • Bag Filtration
  • Chemical Treatment
  • Coagulation
  • Flocculation
  • Chemical Precipitation
  • Neutralization
  • Chemical Oxidation and Reduction
  • Biological Treatment
  • Aerobic Treatment
  • Anaerobic Treatment
  • Biological Nutrient Removal
  • Membrane Treatment
  • Microfiltration
  • Ultrafiltration
  • Nanofiltration
  • Reverse Osmosis
  • Ion Exchange
  • Softening
  • Demineralization
  • Electrodeionization
  • Adsorption
  • Activated Carbon
  • Specialty Adsorption
  • Disinfection
  • Ultraviolet
  • Ozone
  • Chlorination
  • Chlorine Dioxide
  • Advanced Oxidation
  • Ozone-Based Oxidation
  • Ultraviolet-Based Oxidation
  • Other Advanced Oxidation
  • Thermal Treatment
  • Multi-Stage Flash
  • Multiple-Effect Distillation
  • Thermal Evaporation
  • Integrated Multi-Technology Treatment

End-Use Industry

  • Municipal & Public Utilities
  • Industrial
  • Residential & Commercial

Sales Channel

  • Direct Sales
  • Distributor and Dealer
  • OEM and System Integrator
  • Retail and E-Commerce
  • Other Sales Channels

Conclusion & Recommendations

The long-term outlook for the industry remains strongly positive. Global revenue is projected to grow from USD 391.01 billion in 2025 to USD 806.63 billion by 2035 at a 7.51% CAGR. We observed that tightening discharge regulation, water scarcity, and rising industrial process water demand will continue underpinning growth across equipment, chemical, and service categories through the forecast period.

What Strategic Positioning Should Market Suppliers Pursue?

Suppliers should prioritize outsourced service capability while expanding digital monitoring and semiconductor-grade treatment portfolios. Our assessment indicates that providers investing early in water reuse technology and measurable operational efficiency will be best positioned to capture above-market growth within this market.

How Attractive Is the Water Treatment Industry for New Investment?

The industry presents an attractive investment case, supported by a USD 386.26 billion absolute dollar opportunity between 2026 and 2035 and above-average growth in Middle East & Africa and Treatment Services categories. We found that investment attractiveness is highest for providers combining validated technology scale with proven digital efficiency performance.

What Market Shifts and Key Risks Should Stakeholders Monitor?

Stakeholders should monitor high capital cost barriers, energy-intensive treatment processes, and fragmented regional permitting as key risks to the industry. Our analysis shows that providers unable to offer energy-efficient alternatives risk losing contracts to competitors with lower-cost, lower-energy treatment technology, particularly in electricity-constrained regions.

What Are the Key Growth Pathways for the Water Treatment Market?

Key growth pathways include expanding outsourced treatment services, scaling water reuse and recycling technology, and deepening penetration into semiconductor and industrial process water categories. NMSC's analysis indicates that suppliers pursuing these pathways while maintaining regulatory compliance and digital efficiency credentials will be best positioned to capture this market's projected growth through 2035.

FAQs

About the Author

Mayurima Roy

Mayurima Roy

Mayurima Roy is Research Analyst at Next Move Strategy Consulting, where she has spent 4 years working across the firm's full industry coverage rather than a single fixed vertical. Her work centers on structured research, ongoing trend tracking, competitive assessment, and insight-led content development, translating complex market data into clear, decision-ready narratives that support informed client decision-making across diverse global industries, market sectors, and world regions every day.

About the Reviewer

Supradip Baul

Supradip Baul

Supradip Baul is an accomplished business consultant and strategist with over a decade of rich experience in market intelligence, strategy, technology, and business transformation. His work has included rigorous qualitative and quantitative analysis across multiple industries, helping clients shape investment decisions and long-term roadmaps. Earlier in his career, he was associated with Gartner, where he contributed to industry-leading reports and market share analyses. He has worked with leading global companies and holds an MBA with a dual specialization in Marketing and Finance.

Download Free Sample

Melanie Samko

MELANIE SAMKO

Director of Marketing

TOSOH BIOSCIENCE, INC.

The information provided by NMSC is incredibly valuable, thank you so much for such a excellent work. I really appreciate it. I will make sure to reference all of it, in my summary document.

Rishabh Jogani

RISHABH JOGANI

Strategy Analyst

Accenture Japan

We are incredibly impressed with the market report on the real estate market in India provided by Next Move Strategy Consulting. The report was thorough, insightful, and well-structured, offering deep analysis and actionable recommendations. It not only captured the current trends and dynamics but also provided a forward-looking perspective that has been invaluable for our strategic planning. Their team demonstrated exceptional professionalism, attention to detail, and a profound understanding of the industry. The data-driven insights and clarity of presentation exceeded our expectations, making complex market trends easy to understand. We highly recommend Next Move Strategy Consulting to anyone looking for reliable and comprehensive market research services. Their expertise has given us the confidence to navigate the complexities of the Indian real estate market with clarity and foresight.

Gustaf Hummel Burstrom

GUSTAF HUMMEL BURSTROM

Founder

Revline Tools AB

Joseph and the team at Next Move Strategy Consulting have been excellent to work with, in supplying us with relevant market data and forecasts for our specific category. We had some special requirements and they were able to do a custom package to suit our needs. We would definitely recommend them to any other company needing market data and forecasts

Mohit Agarwal

MOHIT AGARWAL

Chief Manager

DryChem India Pvt. Ltd.

Next Move Strategy Consulting is an amazing team of consultants. We required a market study report for our investors on top priority and the team went above and beyond our expectations to deliver the same with ample supporting data within a short time span enabling us to secure the investments and keep our project timeline maintained. Their professionalism, attention to detail, and timely delivery of actionable recommendations have left a lasting impression on our organization.
Robert Sean Trevino

ROBERT SEAN TREVINO

Sr. Director, Head of Strategic Insights & Analytics

Foundation Medicine

I realized that it was a reliable source of information. These days, there are many people who are looking for authentic data, and this is one of the only sources that can offer them with what they need;

Custom Market Research Services

We will customize the research for you if the listed report does not fully match your requirements.
Get 30% Free Customization

Select License

This website uses cookies to ensure you get the best experience on our website. Learn more

✖