Electrocardiograph (ECG) Market by Product (Resting ECG, Stress ECG, Holter Monitors), Lead Type (Single Lead, 3-6 Lead, 12-Lead), End User (Hospitals & Clinics, Home Settings & Ambulatory Surgical Centers (ASCs), Others) - Global Opportunity Analysis and Industry Forecast, 2020 – 2030
Industry: Healthcare | Publish Date: 11-Dec-2024 | No of Pages: 675 | No. of Tables: 399 | No. of Figures: 370 | Format: PDF | Report Code : HC23


US Tariff Impact on Electrocardiograph (ECG) Market
Trump Tariffs Are Reshaping Global Business
Market Definition:
The global Electrocardiograph (ECG) Market size valued to USD 5.37 billion in 2019, is predicted to garner USD 8.87 billion by 2030, with a CAGR of 4.60% from 2020-2030.
Electrocardiograph is a non-invasive medical test that represents the electrical activity of the heart over a time span. In this test electrodes are placed on the skin to give a graph of voltage versus time; detecting the small electrical changes occurring due to depolarization and repolarization of the cardiac muscle during each cardiac cycle. Changes in the normal ECG pattern occur in numerous cardiac abnormalities such as cardiac rhythm disturbances, inadequate coronary artery blood flow, and electrolyte disturbances.
Market Dynamics and Trends:
The global electrocardiograph (ECG) market has witnessed a substantial growth in past few years and is expected to grow at a considerable rate throughout the forecast period, owing to constantly multiplying incidences of casualties due to Cardiovascular Diseases (CVDs). According to the World Health Organization, more than 17.9 million died of Cardiovascular diseases in the year 2016, world-wide. This scenario augments the demand for advanced healthcare facilities offering proper diagnosis, treatment and monitoring of CVDs, hence propagating the market growth.
Besides, factors such as advancements in ECG technologies, a growing number of geriatric populations, and development in healthcare infrastructures, are anticipated in supplementing the market growth throughout the forecast period. Furthermore, the behavioural risk factors such as tobacco consumption, unhealthy food-habits, obesity issues, physical inactivity and alcohol consumption at individual level, are expected to bring an upsurge in the global electrocardiograph (ECG) market, in coming future.
However, cost-effectiveness of premium ECG devices, unfavourable reimbursement policies, and increase in market saturation specifically in the North-America region, are the factors responsible in hampering the electrocardiograph (ECG) market growth during the forecast period.
Moreover, factors such as favourable government initiatives for public welfare, increase in R&D activities and new product launches by the market players, as well as introduction of remote monitoring devices for comprehensive ECG monitoring, are expected to create ample of growth opportunities in the global market in coming future.
Market Segmentations and Scope of the Study:
The electrocardiograph (ECG) market share analysis is based on product, lead type, end user, and geography.
Based on product, the market is segmented into resting ECG, stress ECG, holter monitors. Based on lead type, the market is segmented into the single lead, 3-6 lead, and 12-lead. Based on the end user, the market is segmented into hospitals & clinics, home settings & ambulatory surgical centers (ASCs), and others. Geographic breakdown and analysis of each of the previously mentioned segments include regions comprising North America, Europe, Asia-Pacific, and RoW.
Geographical Analysis
Asia-Pacific region denotes a higher adoption of the electrocardiograph (ECG) and is anticipated to hold the highest market share in the electrocardiograph (ECG) market, during the forecast period. This is attributable to the factors including the increase in developments in the healthcare system, increasing disposable income, favorable government policies, high population base, and large untapped potential market in this region.
North America region would witness increasing market size in the global market, owing to the presence of well-established healthcare facilities, high consumer awareness, and technological advancements.
Competitive Landscape
Comprehensive competitive analysis and profiles of the major market players such as OSI Systems Fukuda Denshi Co Ltd., Opto Circuits Limited, Philips Healthcare, Schiller Ag, General Electric Company, Johnson and Johnson, Mortara Instrument, Inc, Medtronic Plc, Mindray Medical International Limited and others are provided in the electrocardiograph (ECG) industry report.
An upsurge in R&D activities and advancement in product technology with new product launches by the key players, is leading the healthcare infrastructure to new heights, by creating lucrative opportunities for the global electrocardiograph (ECG) market.
For instance, in February 2020, one of the major market players in the global market, Johnson and Johnson, in collaboration with Apple, launched its first ever virtual study app ‘Heartline’ on iPhone, along with the ECG app and irregular rhythm notification feature on the Apple Watch. The ‘Heartline’ is a study that showcases on how digital health tools, like the ECG app and irregular rhythm notification feature on Apple Watch, could lead to earlier detection of atrial fibrillation, helping patients get more aware about their heart health, and improving health outcomes.
Key Benefits
-
The electrocardiograph (ECG) market report provides a quantitative analysis of the current market and estimations through 2020-2030 that assists in identifying the prevailing market opportunities to capitalize on.
-
The study comprises a deep dive analysis of the global market including current and future trends for depicting the prevalent investment pockets in the market
-
The report provides detailed information related to key drivers, restraints, opportunities and their impact on the market.
-
The report incorporates a competitive analysis of the market players along with their market share and market size in the global market.
-
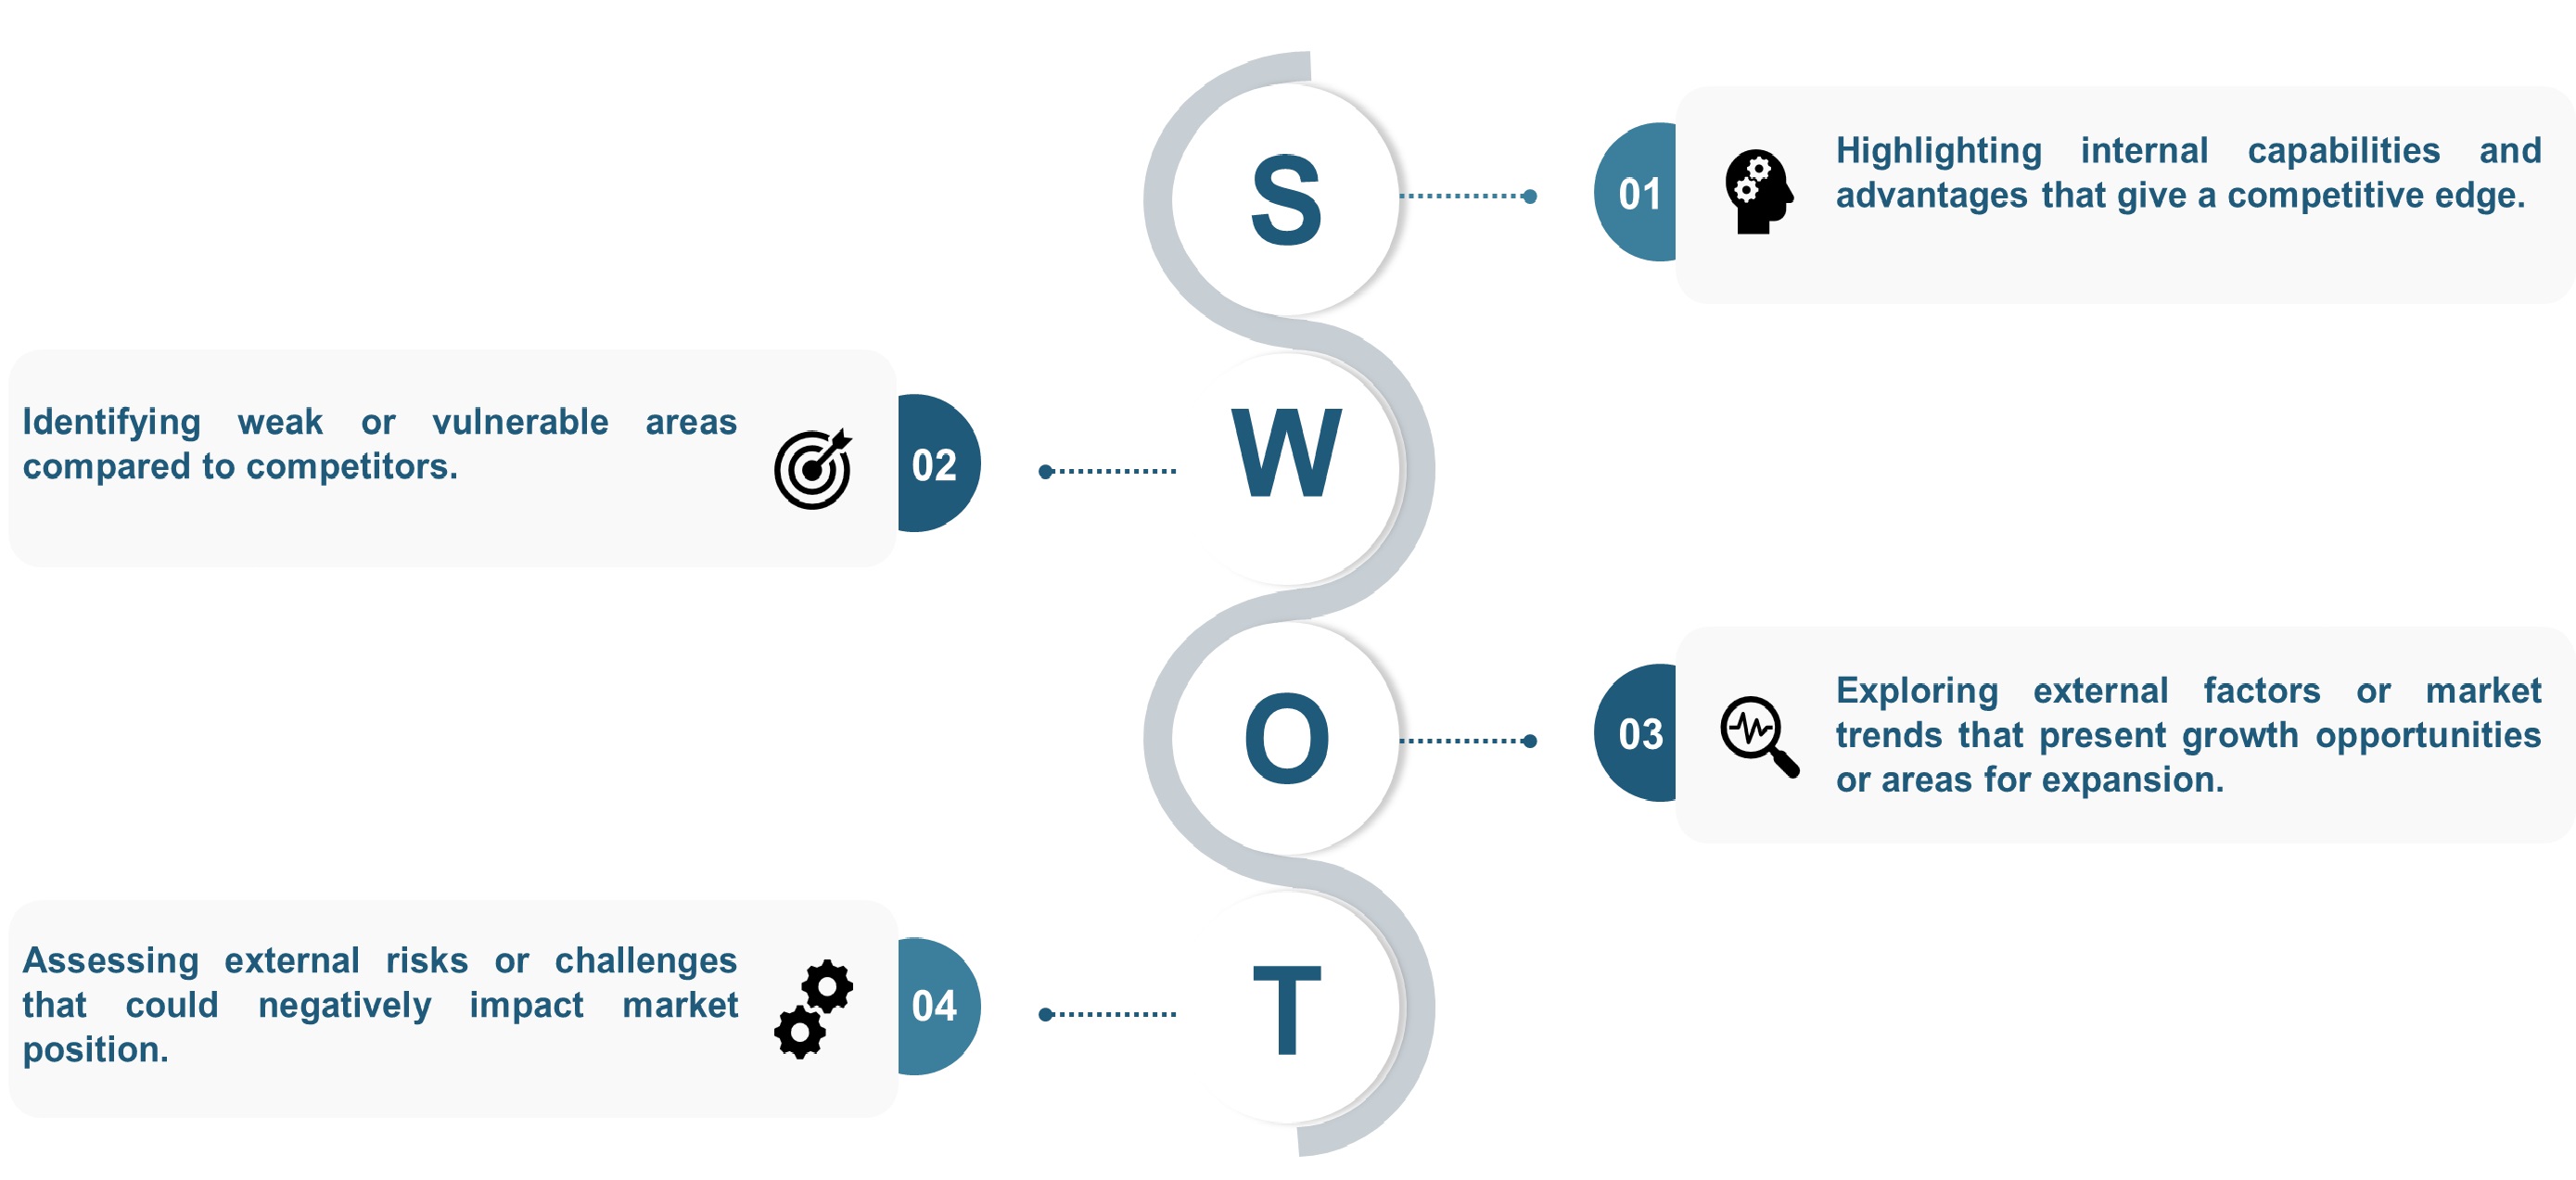
The study elaborates SWOT analysis and Porters Five Forces model along with the market trend analysis.
-
Value chain analysis in the electrocardiograph (ECG) market study provides a clear picture of the stakeholders’ roles.
Electrocardiograph Market Key Segments
By Product
-
Resting ECG
-
Stress ECG
-
Holter Monitors
By Lead Type
-
Single Lead
-
3-6 Lead
-
12-Lead
By End User
-
Hospitals & Clinics
-
Home Settings & Ambulatory Surgical Centers (ASCs)
-
Others
By Geography
-
North America
-
U.S
-
Canada
-
Mexico
-
-
Europe
-
UK
-
Germany
-
France
-
Spain
-
Italy
-
Netherlands
-
Denmark
-
Finland
-
Norway
-
Sweden
-
Russia
-
Rest of Europe
-
-
Asia-Pacific
-
China
-
Japan
-
India
-
South Korea
-
Australia
-
Indonesia
-
Singapore
-
Taiwan
-
Thailand
-
Rest of Asia-Pacific
-
-
RoW
-
Latin America
-
Middle East
-
Africa
-
Key Players:
-
Nihon Kohden Corporation
-
OSI Systems Fukuda Denshi Co Ltd.
-
Opto Circuits Limited
-
Philips Healthcare
-
Schiller AG
-
General Electric Company
-
Johnson and Johnson
-
Mortara Instrument, Inc
-
Medtronic Plc
-
Mindray Medical International Limited
Report Scope and Segmentation
|
Parameters |
Details |
|
Analysis Period |
2019–2030 |
|
Base Year Considered |
2020 |
|
Forecast Period |
2020–2030 |
|
Market Size Estimation |
Billion (USD) |
|
Market Segmentation |
By Product (Resting ECG, Stress ECG, Holter Monitors) By Lead Type (Single Lead, -6 Lead, -Lead) By End User (Hospitals & Clinics, Home Settings & Ambulatory Surgical Centers (ASCs), Other End Users) |
|
Countries Covered |
28 |
|
Companies Profiled |
OSI Systems Fukuda Denshi Co Ltd., Opto Circuits Limited, Philips Healthcare, Schiller Ag, General Electric Company, Johnson and Johnson, Mortara Instrument, Inc, Medtronic Plc, Mindray Medical International Limited |


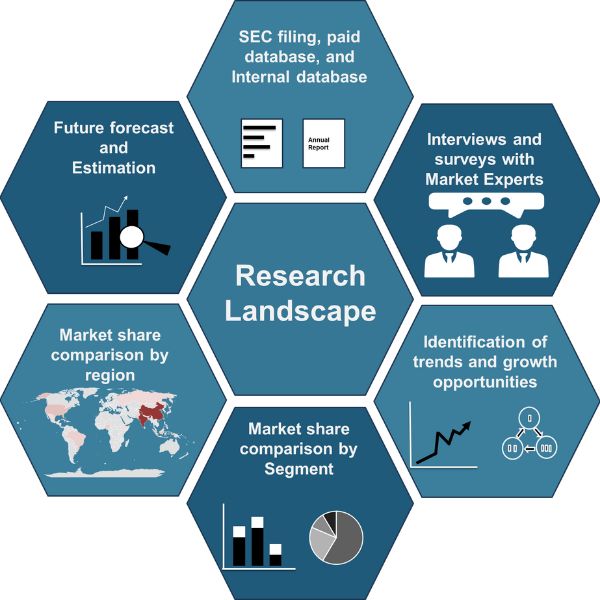
At Next Move Strategy Consulting, we understand that insightful market research is the cornerstone of successful business decisions. That's why we employ a robust and multifaceted approach, combining various methodologies to deliver the most accurate and actionable data for our clients.

Research Landscape
We navigate the world of research with two primary approaches:
Qualitative Approach
Our qualitative research methodologies involve immersive techniques such as in-depth interviews, focus groups, and observational studies. By engaging directly with individuals and stakeholders, we uncover valuable insights that quantitative data alone may overlook.
Quantitative Research
In tandem with qualitative methodologies, NMSC leverages the power of Quantitative Research to provide a robust foundation of numerical insights. Through systematic data collection and analysis, we quantify patterns, preferences, and market trends, offering a comprehensive view of the business landscape.
Our quantitative research approach employs diverse tools, including surveys, experiments, and statistical modelling. These methodologies enable us to gather data from a large and representative sample, ensuring the statistical significance of our findings. By employing structured questionnaires and standardized data collection methods, we guarantee the reliability and validity of the information we present to our clients.
Quantitative research is particularly effective in measuring the prevalence of trends, assessing market size, and gauging the impact of various factors on consumer behavior. The numerical precision attained through this approach equips our clients with actionable insights, facilitating data-driven decision-making and strategy formulation.
Our Specialized Toolbox for Industry-Specific Market Research
We deploy a specialized arsenal of techniques tailored to meet your unique requirements. Here's a glimpse into our comprehensive toolbox:

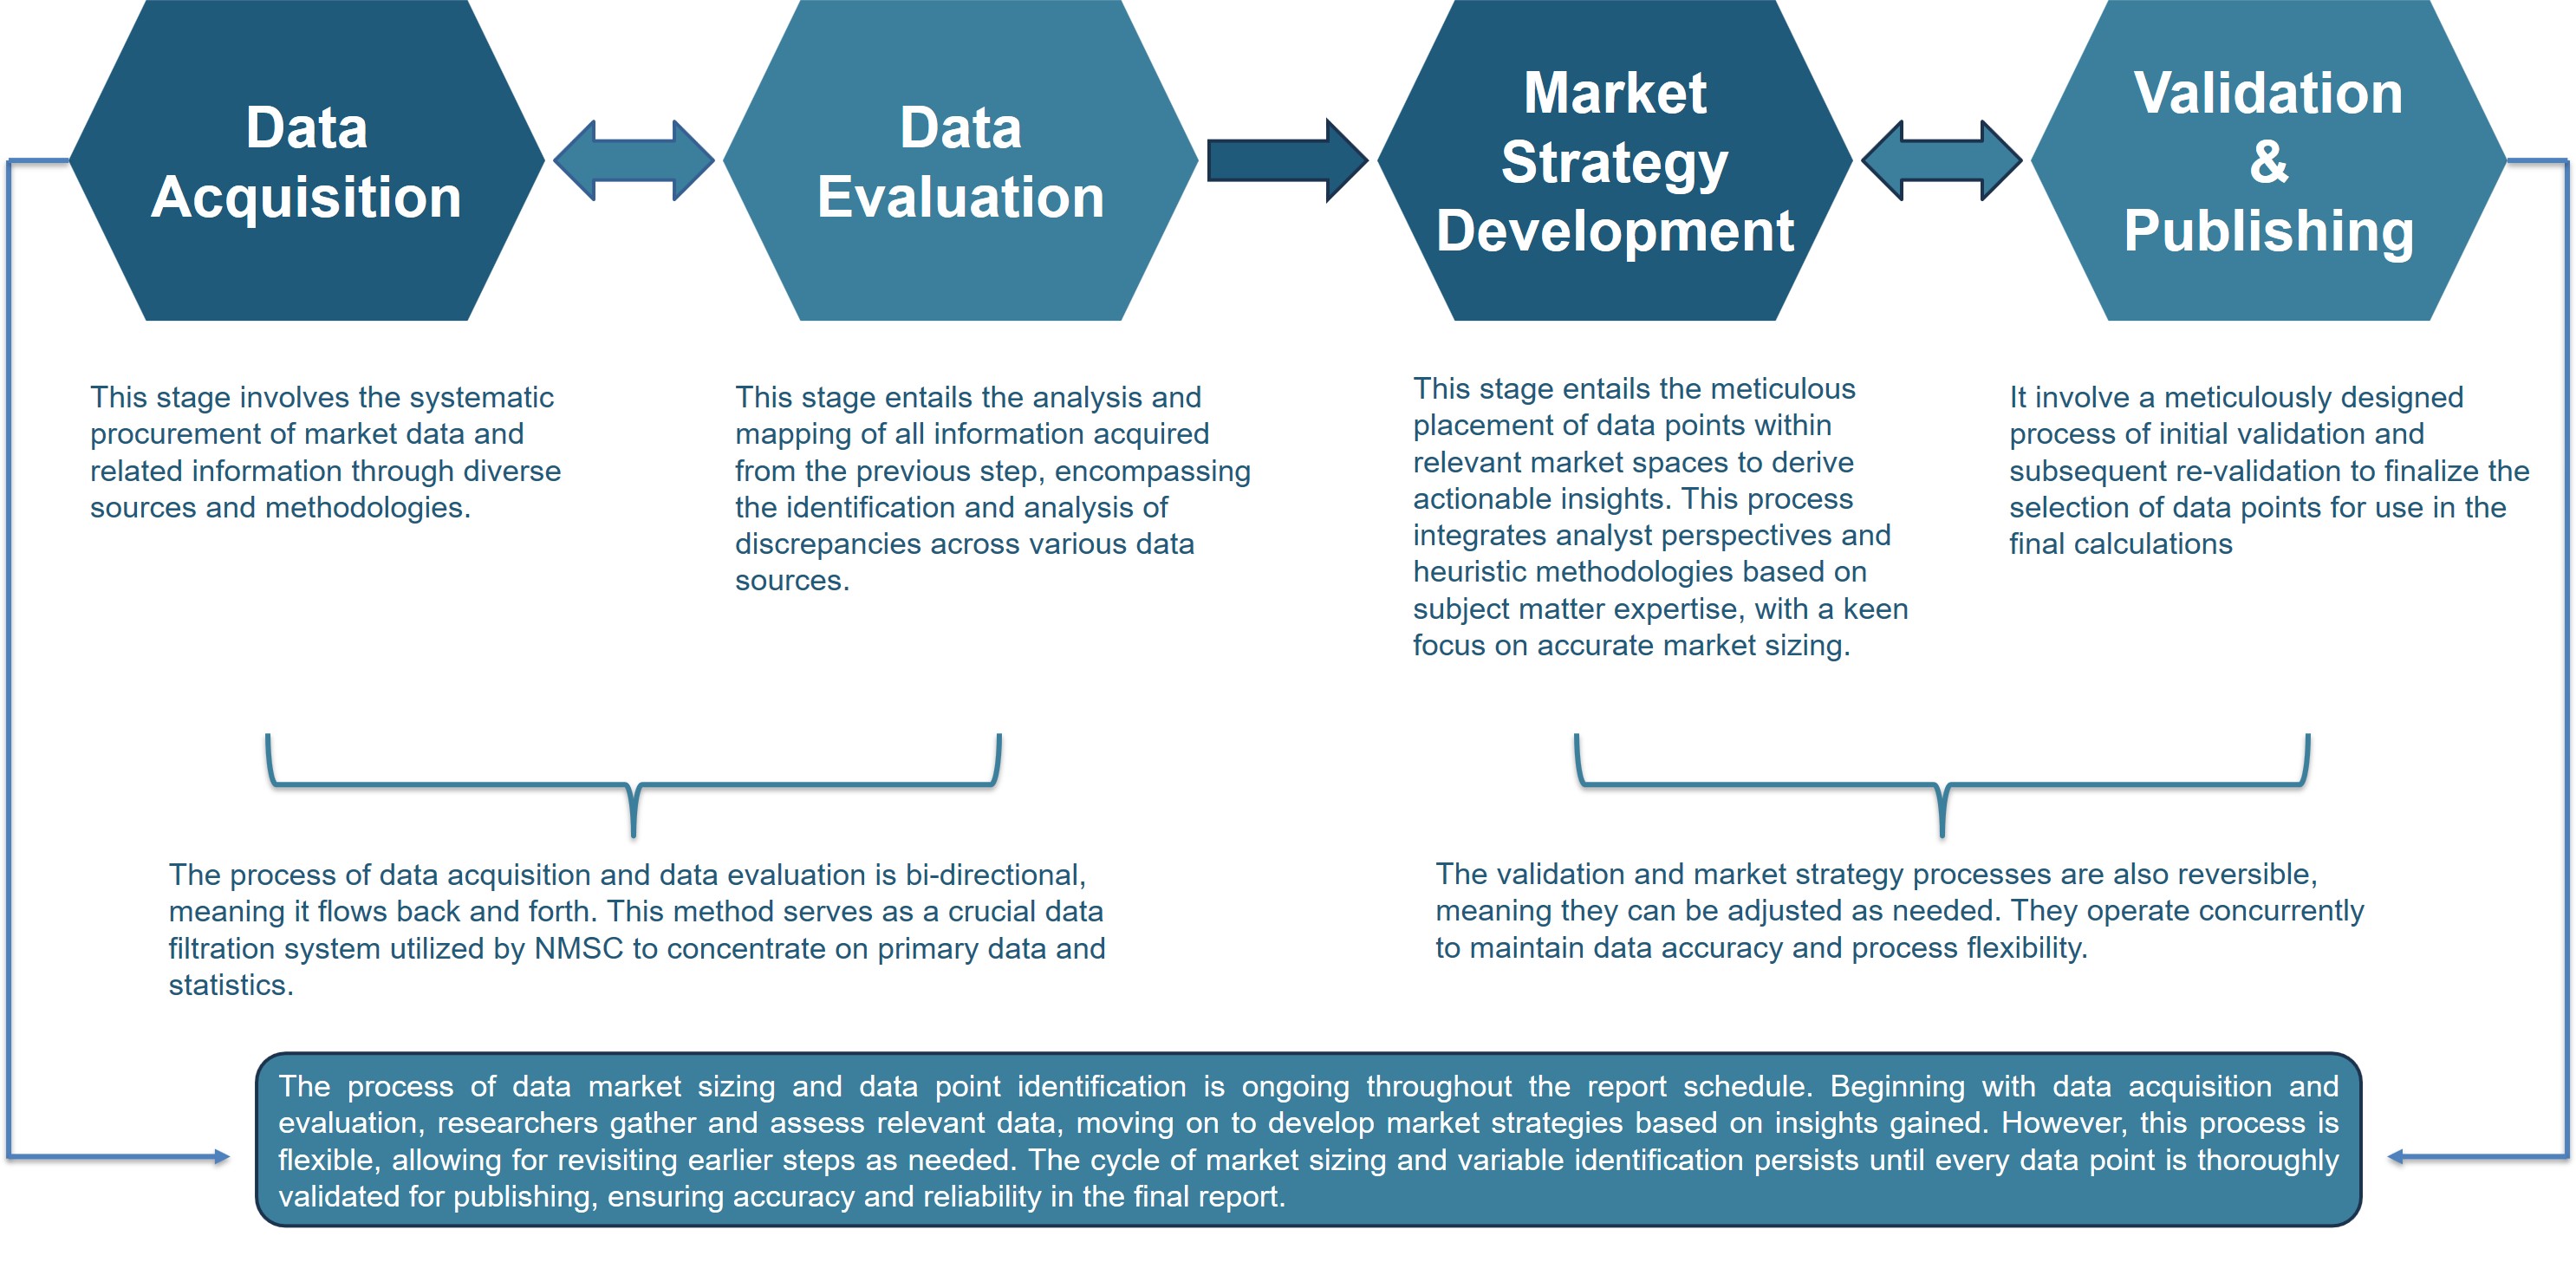
Information Procurement
The stage entails acquiring market data or relevant information through various sources and methodologies.


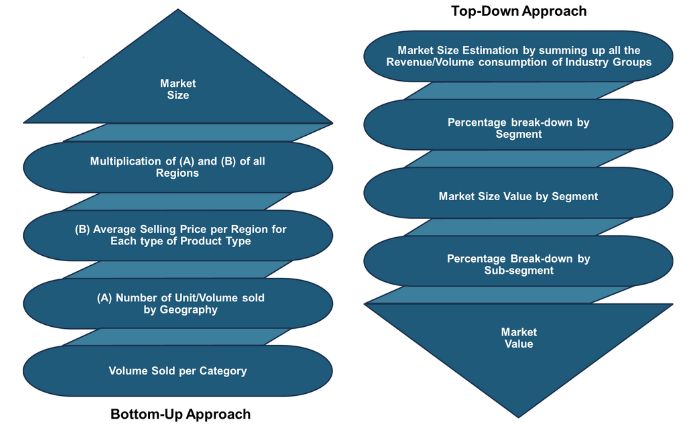
Market Research Approach
We utilize both top-down and bottom-up approaches in market research analysis to achieve a comprehensive understanding of the market dynamics, leveraging the broad perspective of industry trends and macroeconomic factors alongside detailed insights from specific segments and individual companies.
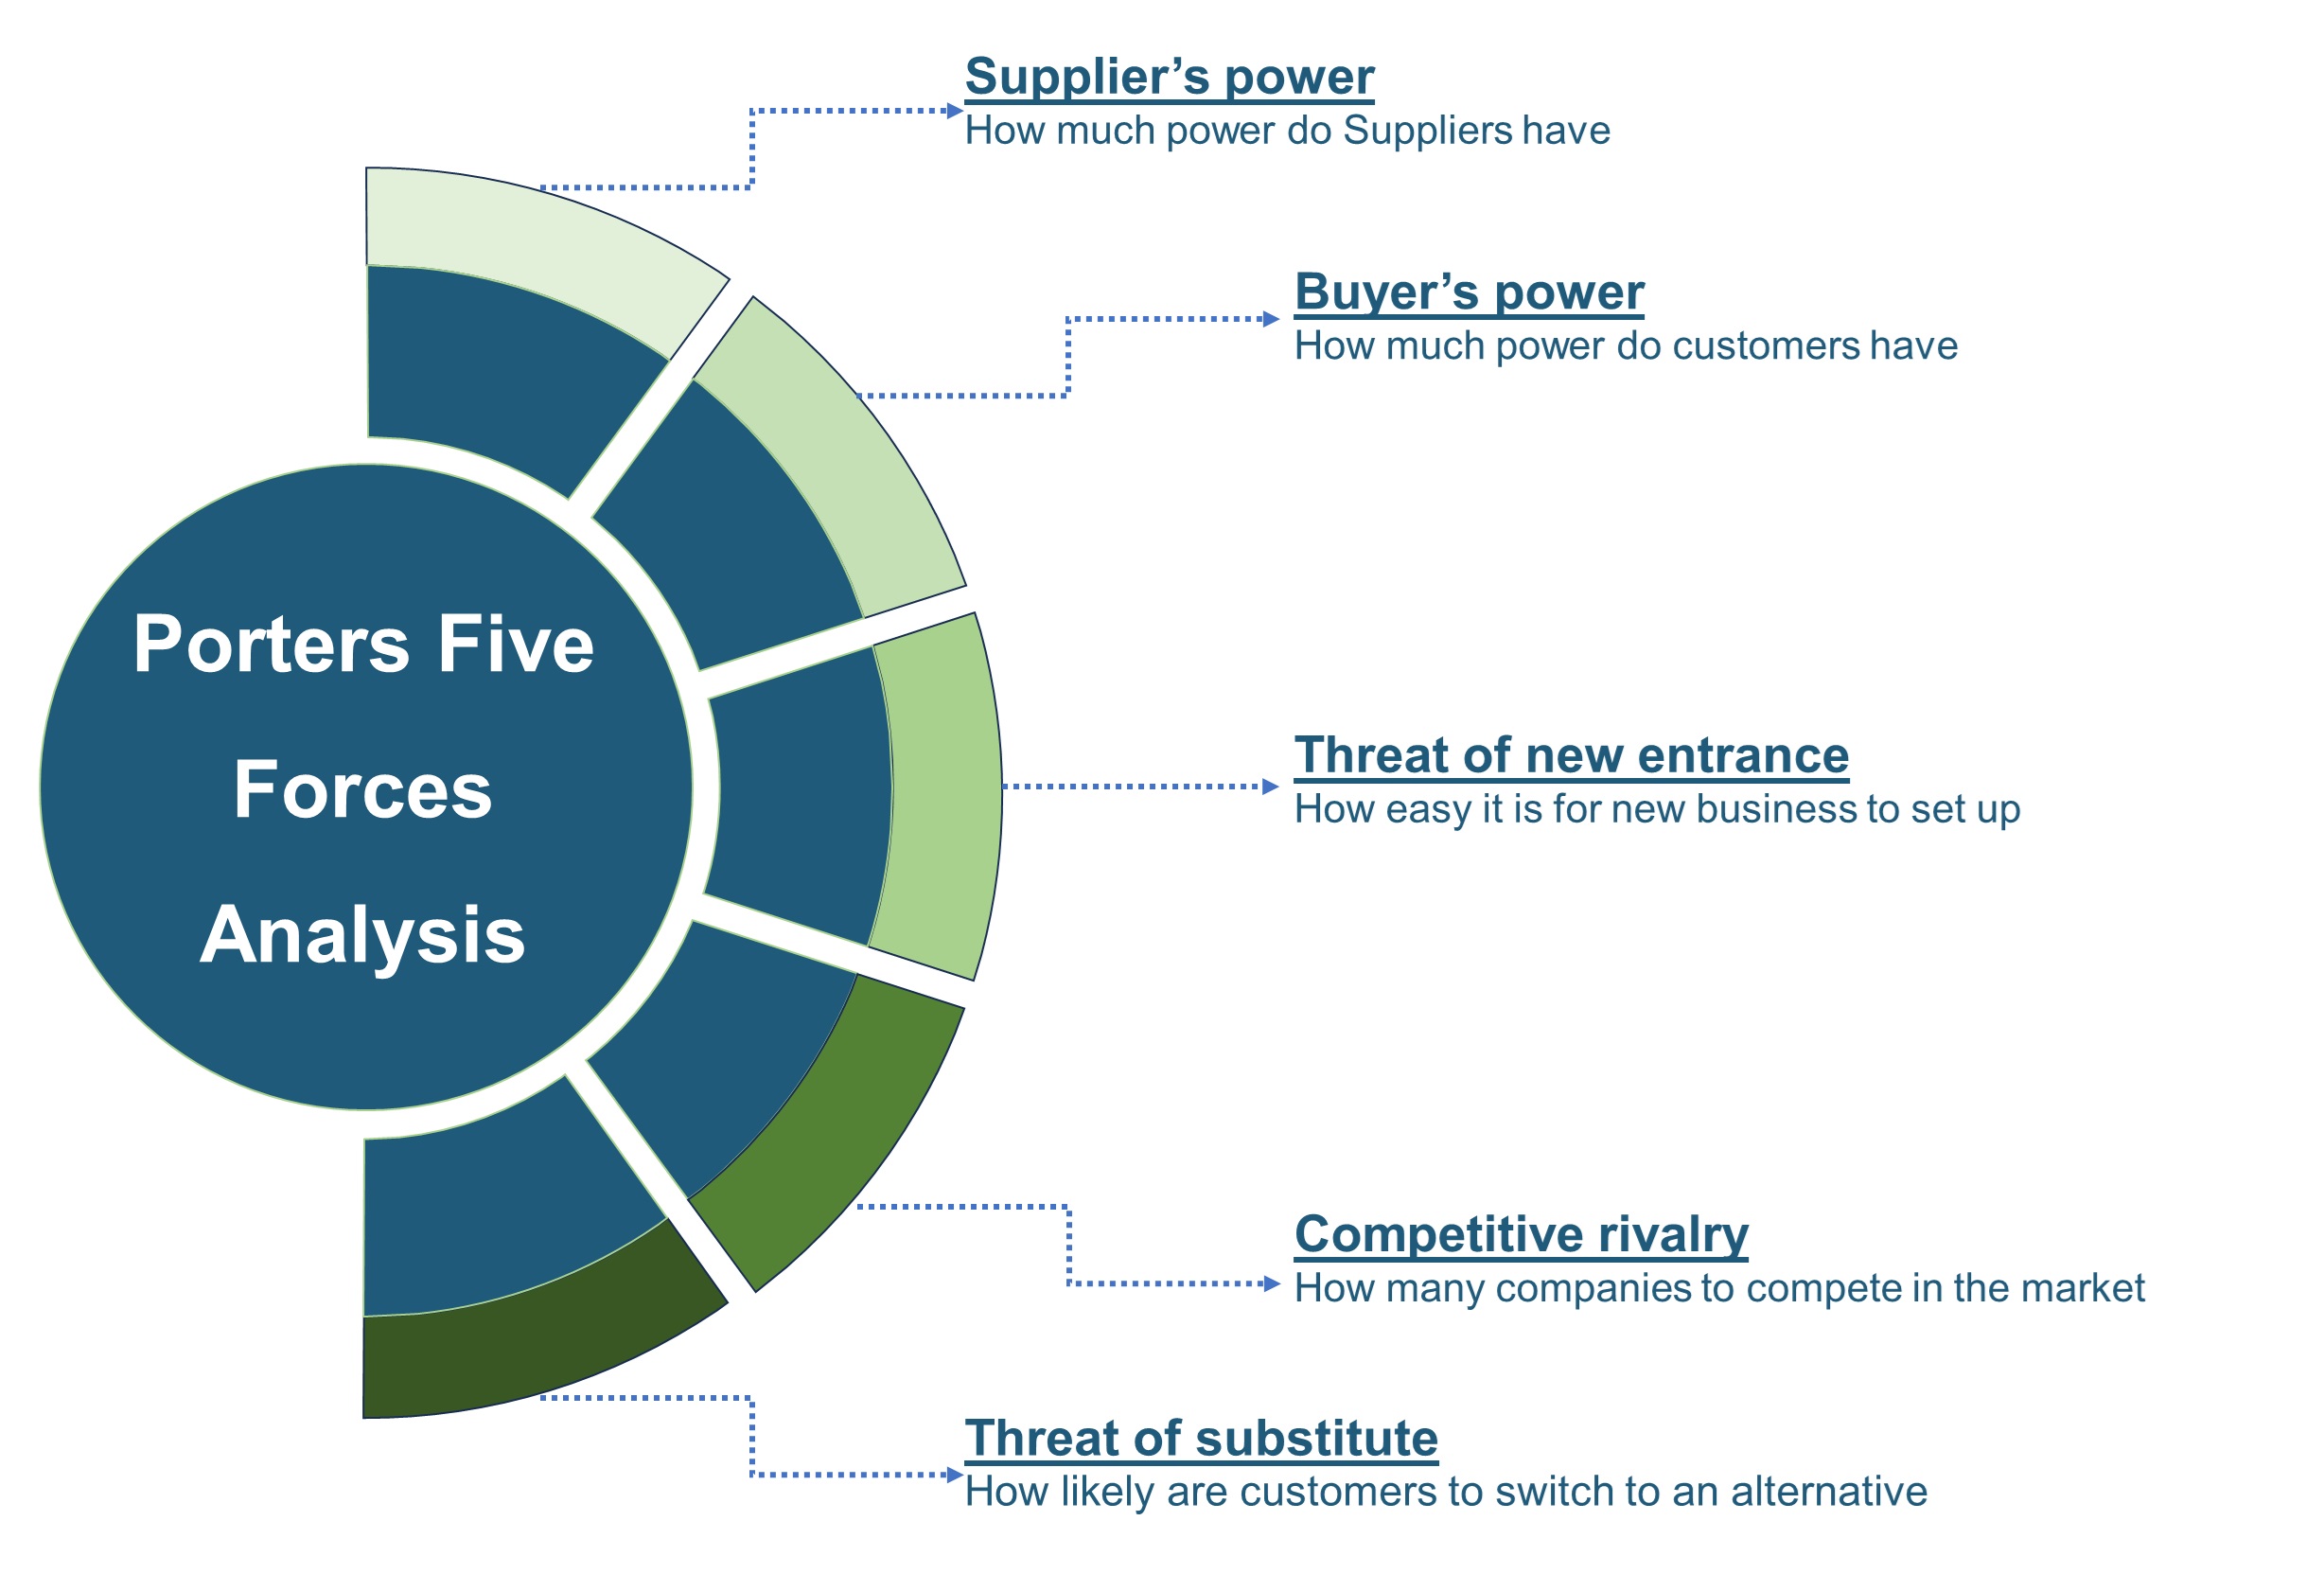
Porters Five Forces Analysis
We conduct Porter's Five Forces analysis to evaluate the competitive landscape of an industry, providing us with insights into factors that affect profitability and strategic positioning.
SWOT Analysis
We conduct SWOT analysis to understand market trends, identify potential threats, capitalize on opportunities, and assess our strengths and weaknesses.
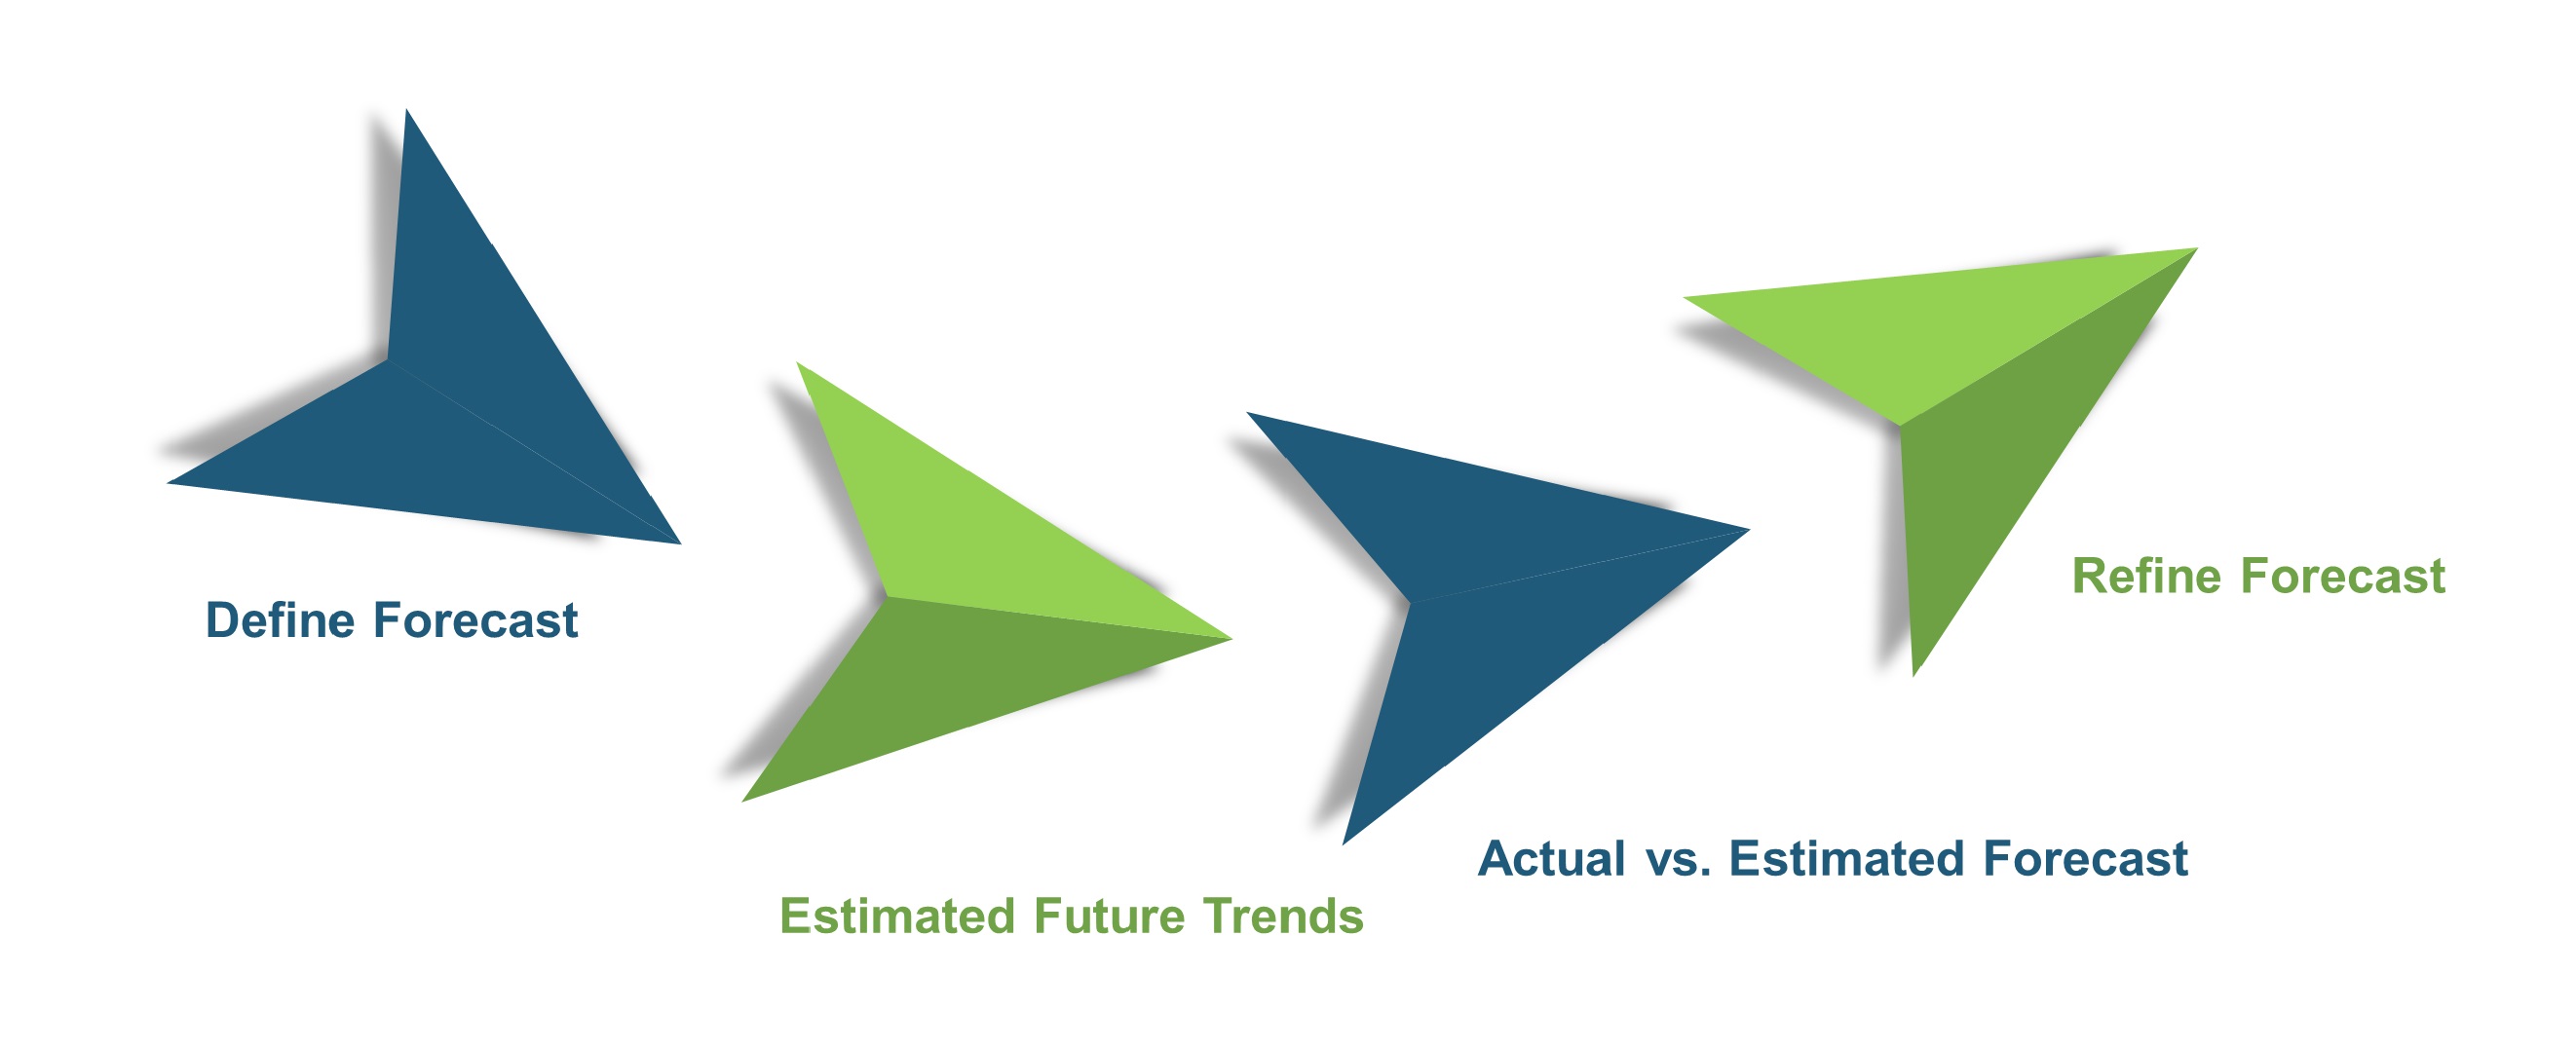
Forecasting
We utilize a forecasting model to predict future consumption by considering parameters like population, economics, regulations, market competition, drivers, constraints, technology, and pricing. We also employ statistical techniques such as multilinear regression, exponential smoothing, moving average, ARIMA, and Monte Carlo simulations for accurate predictions. In econometric forecasting, we analyzed short-term and long-term event impacts, attributing values based on regulatory frameworks, economic factors, and market events.
Frequently Asked Questions
Download Free Sample
 Speak to Our Analyst


Related Report


Related Blogs
How Companies Shape the Blood Gas Analyzer Market
According to Next Move Strategy Consulting, the global blood gas and electrolyte...


Who’s Leading the Surgical Instrument Market?
Next Move Strategy Consulting forecasts more than 1.7-fold growth in the global...

Why Dentsply, Philips, and Vatech Lead the CBCT Industry
Next Move Strategy Consulting predicts a significant growth of more than two-fol...