Expense Tracking Apps Market by Purpose (Personal Finance, Business Expense Tracking, and Team Collaboration), by Features (Expense Recording, Receipt Management, Reporting and Analytics, and Others), by Device Compatibility (iOS, Android, and Web), by Deployment Model (Cloud-Based, On-Premise, and Hybrid), and by End-User (Businesses (Small Sized Businesses, Mid-Sized Businesses, and Others), Non-Profit Organizations, and Personal) – Global Opportunity Analysis and Industry Forecast 2025 - 2030


US Tariff Impact on Expense Tracking Apps Market
Trump Tariffs Are Reshaping Global Business
Expense Tracking Apps Market Overview
The global Expense Tracking Apps Market size was valued at USD 7.15 billion in 2024 and is predicted to reach USD 14.44 billion by 2030 with a CAGR of 12.3% from 2025-2030.
The drivers such as growing adoption of smartphones and other smart devices, growing adoption of cashless transactions along with expansion of travel and tourism industry propels the market growth. Impact of data breaches and unauthorized access to financial data, however, restricts the market growth. Conversely, technology advancements such as introduction of artificial intelligence create future prospects for the market growth.
In addition, leading firms namely Jupiter Money, Expensify, Inc, and others are adopting different strategies including product launch and partnerships to boost their position and product offerings in the market. With the changing market, companies are more inclined towards improving user experience with intuitive interfaces, deeper analytics, and customized financial advice. The market competition compels constant innovation resulting in more advanced features and services.
Increasing Adoption of Smartphones and other Smart Devices Boosts the Market Growth
Growing user base of smartphones fuels the need for expense tracking apps as users want easy solutions to manage finances. These apps provide users with easy tracking of expenditure along with budget setting and real time feedback providing a better and a more accessible way to control finances from the convenience of their own smartphones. As per Global System for Mobile Communication Association, smartphone penetration in Latin America stood at 80% in 2023 and is expected to reach 92% by 2030, similarly, in Middle East and North Africa it stood at 81% and is projected to rise to 90% by 2030 respectively. This surge in adoption of smartphone across various region drives the demand for various applications including finance tracking to efficiently manage and record the transactions.
Rising Adoption of Cashless Transactions Drives the Market Growth
The rising adoption of digital payment methods and cashless transactions drives the growth of the expense tracking apps market with capability to capture and categorize digital transactions, making them highly effective tools for financial management. This reduces the need for manual data entry and reporting ensuring greater transparency and accuracy in financial tracking.
According to a report published by Capgemini, non cash transaction volumes reached 1.30 trillion by 2023 globally. As consumers and businesses adopt new digital payment schemes, the growth is expected accelerate to 2.30 trillion by 2027 growing at a rate of 15% annually. The rise in digital payment drives the expense tracking apps market demand to efficiently track the expenses incurred driving the growth of the market.
Expansion of Travel and Tourism Industry Drives the Market Growth
The expansion of travel and tourism industry drives the demand of these tracking apps as the applications allow tourist to track and manage their spending in such a manner so that they can easily remain within their financial limits while traveling. As per the latest report from the World Travel & Tourism Council, travel & tourism sector accounted for 9.1% of the global GDP, an 23.2% increase over 2022. Expansion of travel and tourism industry thus, translates into higher demand for expense tracking apps, showing the growing relevance of these for travelers looking to track their expenses.
Impact of Data Breaches and Unauthorized Access to Financial Information Hinders the Market Growth
Unauthorized access to monetary data and financial information breaches inhibits the market growth. It slows down consumer confidence and adoption of cashless transactions, making it more expensive for financial institutions to enhance security, thereby hindering of the expense tracking apps market growth.
Advancement of Technologies Creates Future Opportunities for the Market Growth
Advancements of technologies such as artificial intelligence is expected to create future opportunities in the expense tracking app market. AI technologies are revolutionizing the expense tracking app industry by categorizing expenses automatically, delivering customized money insights, and providing predictive analytics to aid in budgeting. The technologies simplify the process and make it accurate and quicker, pushing growth and innovation in the industry.
Market Segmentations and Scope of the Study
The expense tracking apps market report is segmented on the basis of purpose, features, device compatibility, deployment model, end-user and region. On the basis of purpose, the market is bifurcated into personal finance, business expense tracking, and team collaboration. On the basis of features the market is segmented into expense recording, receipt management, reporting and analytics, and integration with accounting software. On the basis of device compatibility, the market is segmented into iOS, Android, and Web.
On the basis of deployment model, the market is divided into cloud-based, on-premises and hybrid. On the basis of industry vertical, the market is classified into small businesses, mid-sized businesses, large enterprises, and non-profit organizations. On the basis of end-user, the market is divided into business, non-profit organizations, and personal. Business is again divided into small sized businesses, mid-sized businesses, and large enterprises. Geographic breakdown and analysis of each of the aforesaid segments include regions comprising North America, Europe, Asia-Pacific, and RoW.
Geographical Analysis
North America is the highest expense tracking apps market shareholder. It is likely to retain this position in the forecast period due to the rise in disposable incomes. As disposable income rises people tend to use various methods to track their spendings. The Organization for Economic Cooperation and Development reported that per capita household gross disposable income in Canada stood at USD 35,548 in 2023 reflecting a growth of 3.2% in just one year. With the increasing disposable income, people are looking for expense-tracking apps to help them with their accounting.
Furthermore, the growing tourism industry in North American region such as the U.S., Canada and Mexico drives market growth. These applications allow tourist to track and manage their spending in such a manner so that they can easily remain within their financial limits while traveling. According to a World Travel and Tourism report, North America expects to grow by USD 3.1 trillion by 2032 at a compound annual growth rate of 3.9% over the coming ten years. High growth in tourist and tourism industry thus, translates into higher demand for expense tracking apps, showing the growing relevance of these for travelers looking to track their expenses.
On the other hand, Asia-Pacific shows a steady rise in spending tracker app market during the forecast period. The high volume of digital payment transactions in countries includes India, China, and Japan. The increase in digital payments fuels the demand for expense tracking apps by creating a need for users to monitor, manage and optimize their financial activities. A report from the Ministry of Finance indicates that digital transactions in India increased from USD 0.32 billion in 2018 to USD 1.64 billion by 2023. Higher usage of digital finance tools as indicated by digital payments growth contributed to the growth of the market.
Furthermore, the rising number of smartphone user in this region drives the demand for expense tracking app. As the number of smartphone users increases, it proportionally increases the demand for expense tracking apps as people seek convenient ways to manage their personal finances. These apps provide users with easy tracking of their spending, enabling them to establish budgets and receiving real-time reminders providing an effective and convenient method of staying financially in control via their phones. As per GSMA's 2023 published report, the Asia-Pacific smartphone adoption reached 78% and is set to reach 91% by the year 2030. This growth expands the user base and makes the financial management more accessible.
Competitive Landscape
The expense tracking apps industry trends comprising of various key players such as Happay, Jupiter Money, Yodlee Inc., Spendee a.s., Concur Technologies, Inc., Calero, Emburse, Rydoo, Intrunic Inc., Wave Financials Inc., YNAB, Quicken, Lampo Licensing, LLC., Goodbudget, Invoice2go, LLC, and others. These companies are adopting various strategies including product launch, to maintain their dominance in these tracking apps market.
For instance, in May 2024, Jupiter Money launches new savings feature for millennial users. With young consumers preferring to make purchases online through ecommerce websites, food delivery platforms and quick commerce. This new launch allows investment of a predetermined amount every time a user of the company’s eponymous mobile application makes a transaction through the app. The investment goes into digital gold and mutual funds.
Additionally, in November 2024 Happay expanded its offerings by launching a B2B payments solution on Bharat Connect, developed in collaboration with the National Payments Corporation of India, an Indian public sector company that operates retail payments and settlement systems in the country. Such product launch is anticipated to drive the expansion of the market in a rapid manner.
Key Benefits
-
The report provides quantitative analysis and estimations of the expense tracking apps market from 2025 to 2030, that assists in identifying the prevailing market opportunities.
-
The study comprises a deep dive analysis of the current and future expense tracking apps market trends to depict prevalent investment pockets in the industry.
-
Information related to key drivers, restraints, and opportunities and their impact on the expense tracking apps market is provided in the report.
-
Competitive analysis of the players, along with their market share is provided in the report.
-
SWOT analysis and Porters Five Forces model is elaborated in the study.
-
Value chain analysis in the market study provides a clear picture of roles of stakeholders.
Expense Tracking Apps Market Key Segments
By Purpose
-
Personal Finance
-
Business Expense Tracking
-
Team Collaboration
By Features
-
Expense Recording
-
Receipt Management
-
Reporting and Analytics
-
Integrating with Accounting Software
By Device Compatibility
-
iOS
-
Android
-
Web
By Deployment Model
-
Cloud-Based
-
On-premise
-
Hybrid
By End-User
-
Businesses
-
Small Businesses
-
Mid-Sized Businesses
-
Large Enterprises
-
Non-profit organizations
-
Personal
By Region
-
North America
-
The U.S.
-
Canada
-
Mexico
-
-
Europe
-
The UK
-
Germany
-
France
-
Italy
-
Spain
-
Denmark
-
Netherlands
-
Finland
-
Sweden
-
Norway
-
Russia
-
Rest of Europe
-
-
Asia-Pacific
-
China
-
Japan
-
India
-
South Korea
-
Australia
-
Indonesia
-
Singapore
-
Taiwan
-
Thailand
-
Rest of Asia-Pacific
-
-
RoW
-
Latin America
-
Middle East
-
Africa
-
Key Players
-
Happay
-
Jupiter Money
-
Yodlee Inc.a
-
Spendee a.s.
-
Concur technologies, Inc.
-
Calero
-
Emburse
-
Rydoo
-
Intuit Inc.
-
Wave Financial Inc.
-
YNAB
-
Quicken
-
Lampo Licensing, LLC.
-
Goodbudget
-
Invoice2go, LLC.
REPORT SCOPE AND SEGMENTATION:
|
Parameters |
Details |
|
Market Size in 2024 |
USD 7.15 billion |
|
Revenue Forecast in 2030 |
USD 14.44 billion |
|
Growth Rate |
CAGR of 12.3% from 2025 to 2030 |
|
Analysis Period |
2024–2030 |
|
Base Year Considered |
2024 |
|
Forecast Period |
2024–2030 |
|
Market Size Estimation |
Billion (USD) |
|
Growth Factors |
|
|
Countries Covered |
28 |
|
Companies Profiled |
15 |
|
Market Share |
Available for 10 companies |
|
Customization Scope |
Free customization (equivalent up to 80 working hours of analysts) after purchase. Addition or alteration to country, regional, and segment scope. |
|
Pricing and Purchase Options |
Avail customized purchase options to meet your exact research needs. |
At Next Move Strategy Consulting, we understand that insightful market research is the cornerstone of successful business decisions. That's why we employ a robust and multifaceted approach, combining various methodologies to deliver the most accurate and actionable data for our clients.
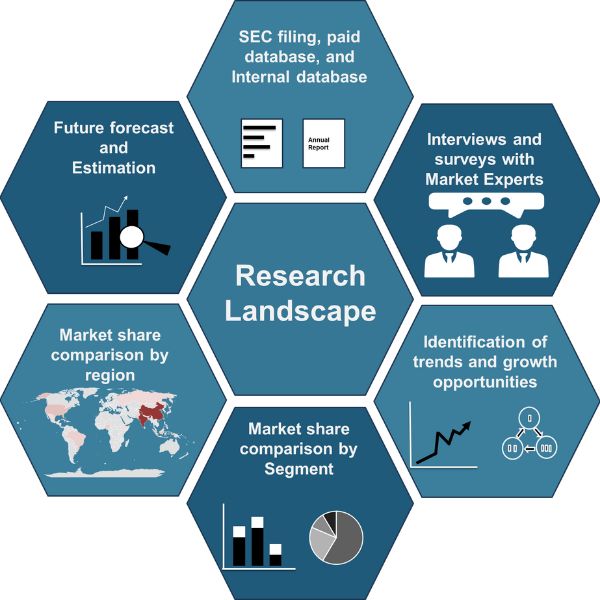
Research Landscape
We navigate the world of research with two primary approaches:
Qualitative Approach
Our qualitative research methodologies involve immersive techniques such as in-depth interviews, focus groups, and observational studies. By engaging directly with individuals and stakeholders, we uncover valuable insights that quantitative data alone may overlook.
Quantitative Research
In tandem with qualitative methodologies, NMSC leverages the power of Quantitative Research to provide a robust foundation of numerical insights. Through systematic data collection and analysis, we quantify patterns, preferences, and market trends, offering a comprehensive view of the business landscape.
Our quantitative research approach employs diverse tools, including surveys, experiments, and statistical modelling. These methodologies enable us to gather data from a large and representative sample, ensuring the statistical significance of our findings. By employing structured questionnaires and standardized data collection methods, we guarantee the reliability and validity of the information we present to our clients.
Quantitative research is particularly effective in measuring the prevalence of trends, assessing market size, and gauging the impact of various factors on consumer behavior. The numerical precision attained through this approach equips our clients with actionable insights, facilitating data-driven decision-making and strategy formulation.
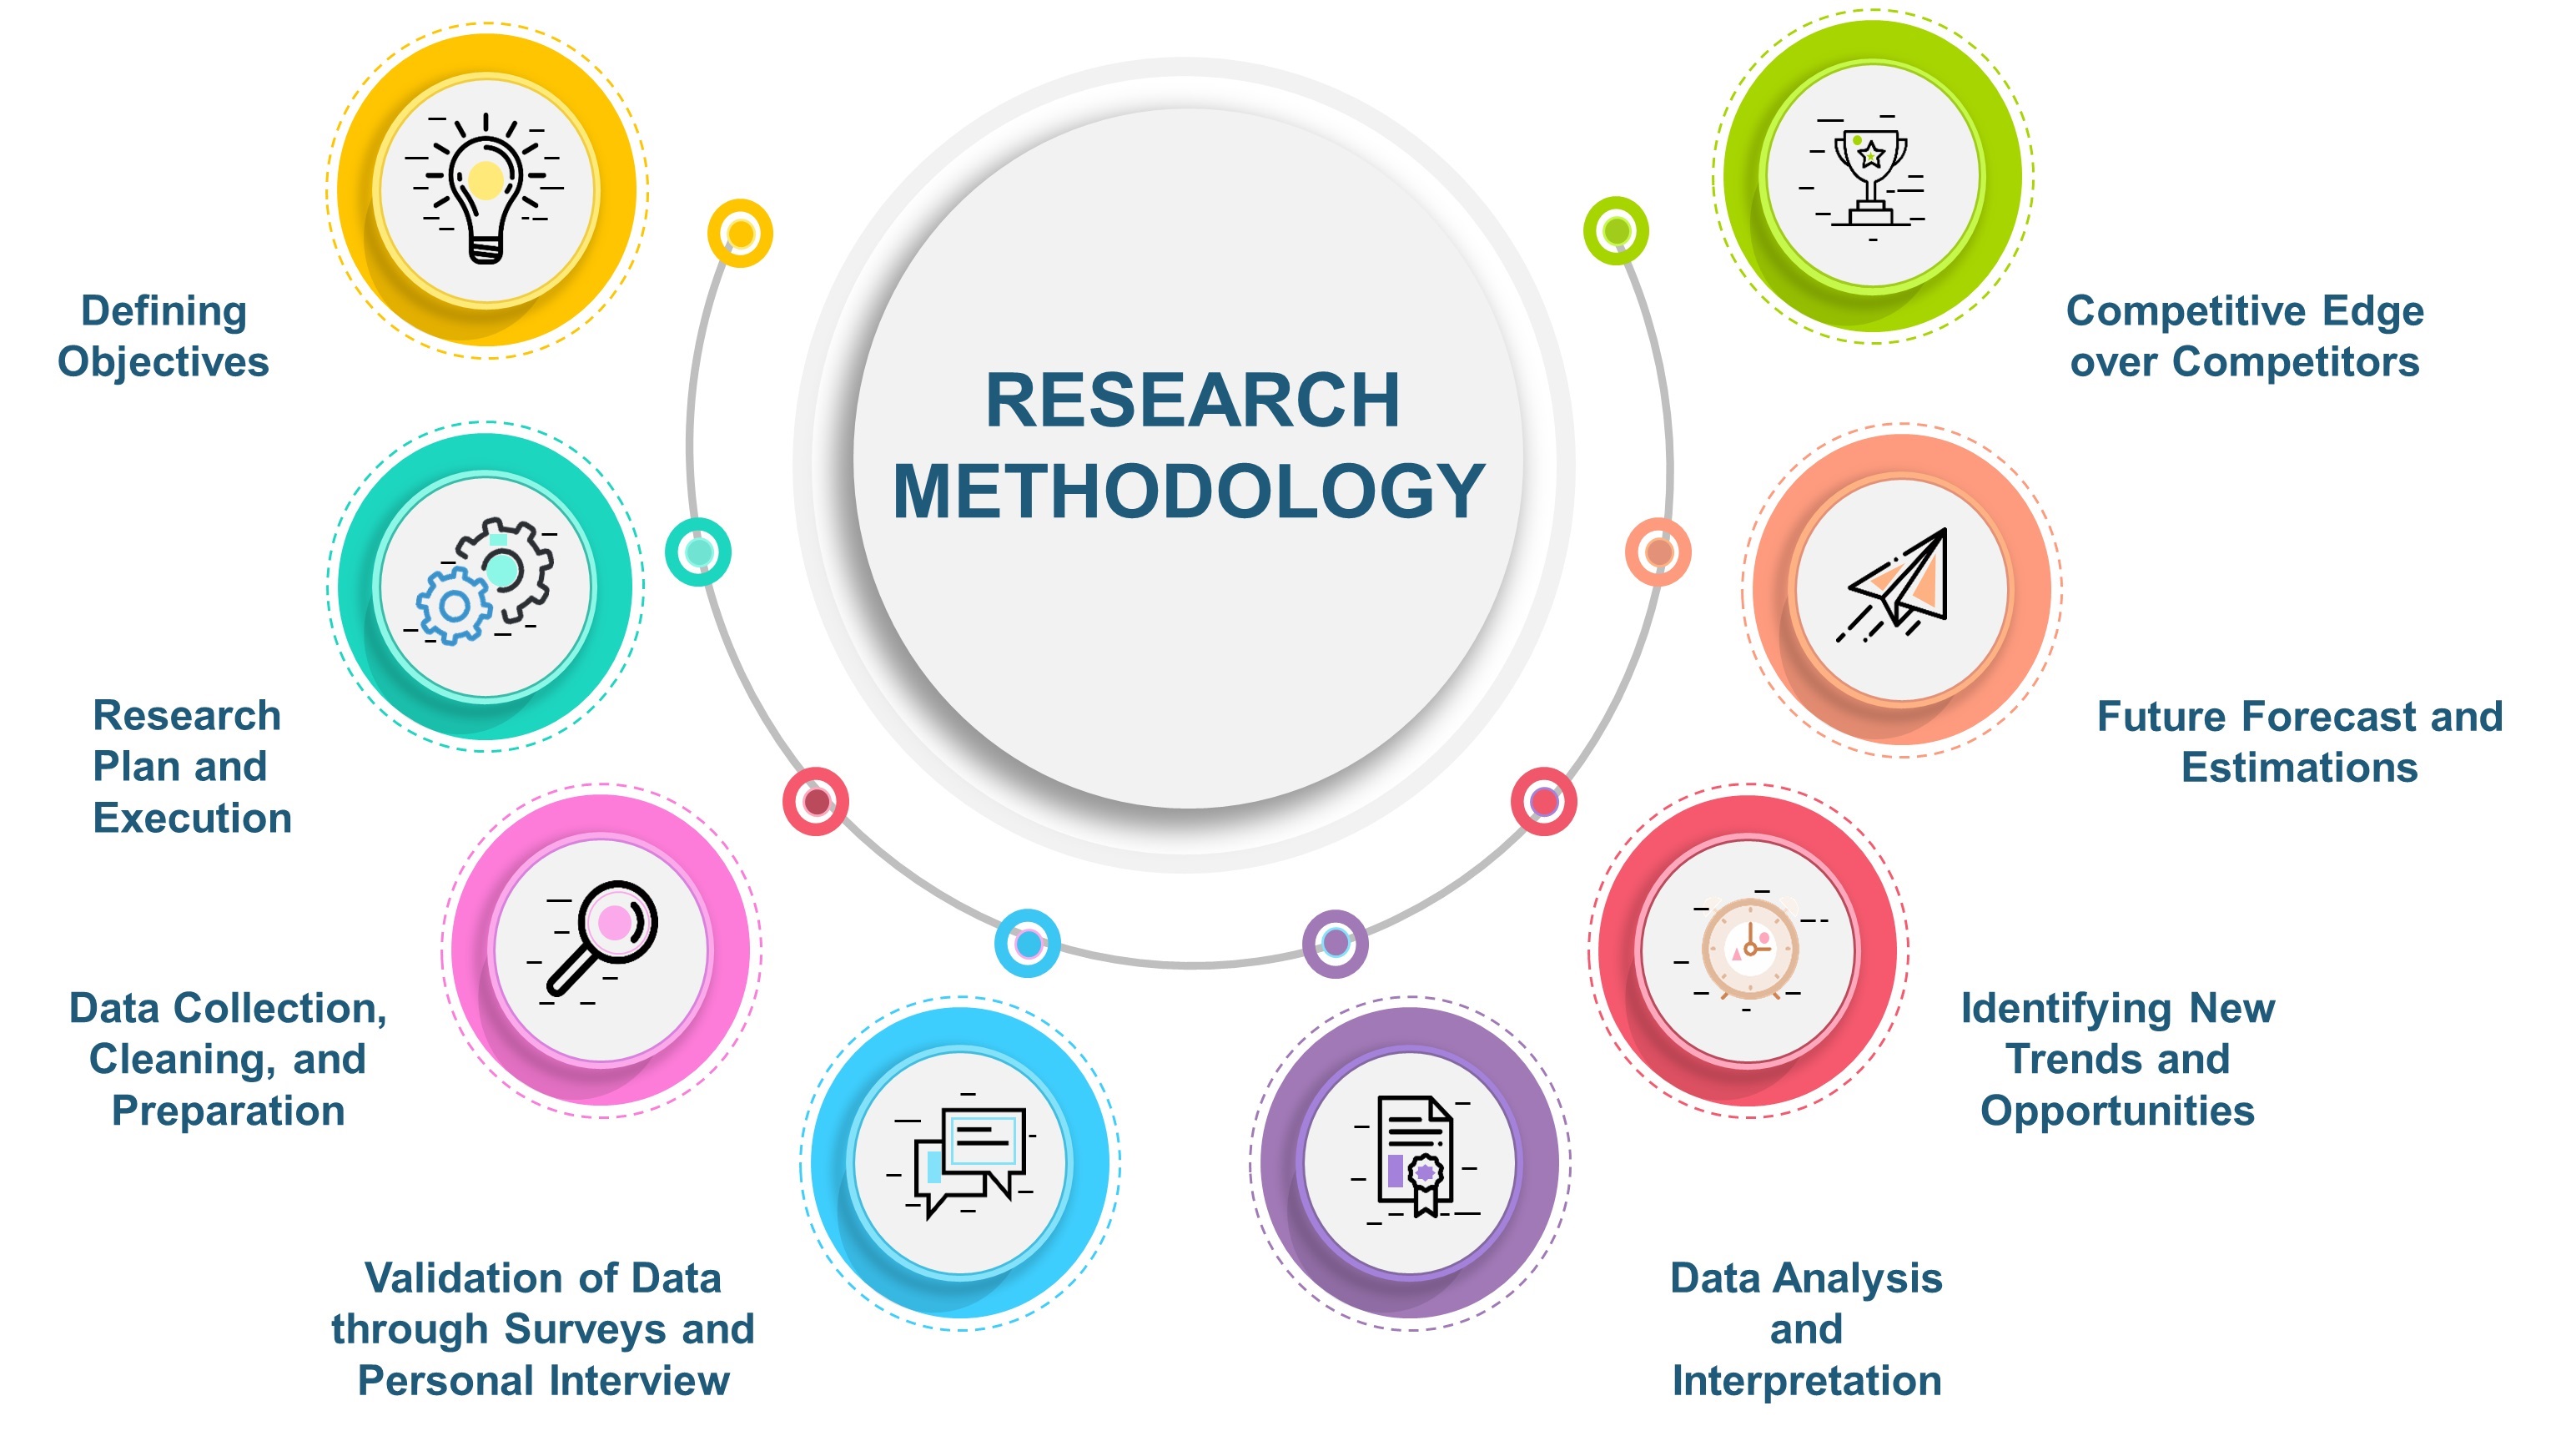
Our Specialized Toolbox for Industry-Specific Market Research
We deploy a specialized arsenal of techniques tailored to meet your unique requirements. Here's a glimpse into our comprehensive toolbox:

Information Procurement
The stage entails acquiring market data or relevant information through various sources and methodologies.


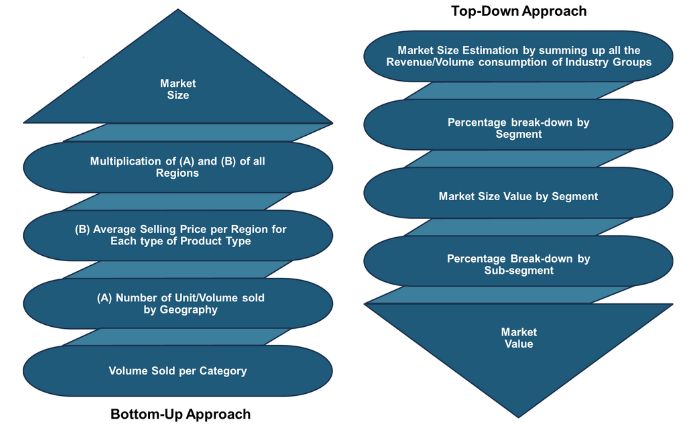
Market Research Approach
We utilize both top-down and bottom-up approaches in market research analysis to achieve a comprehensive understanding of the market dynamics, leveraging the broad perspective of industry trends and macroeconomic factors alongside detailed insights from specific segments and individual companies.
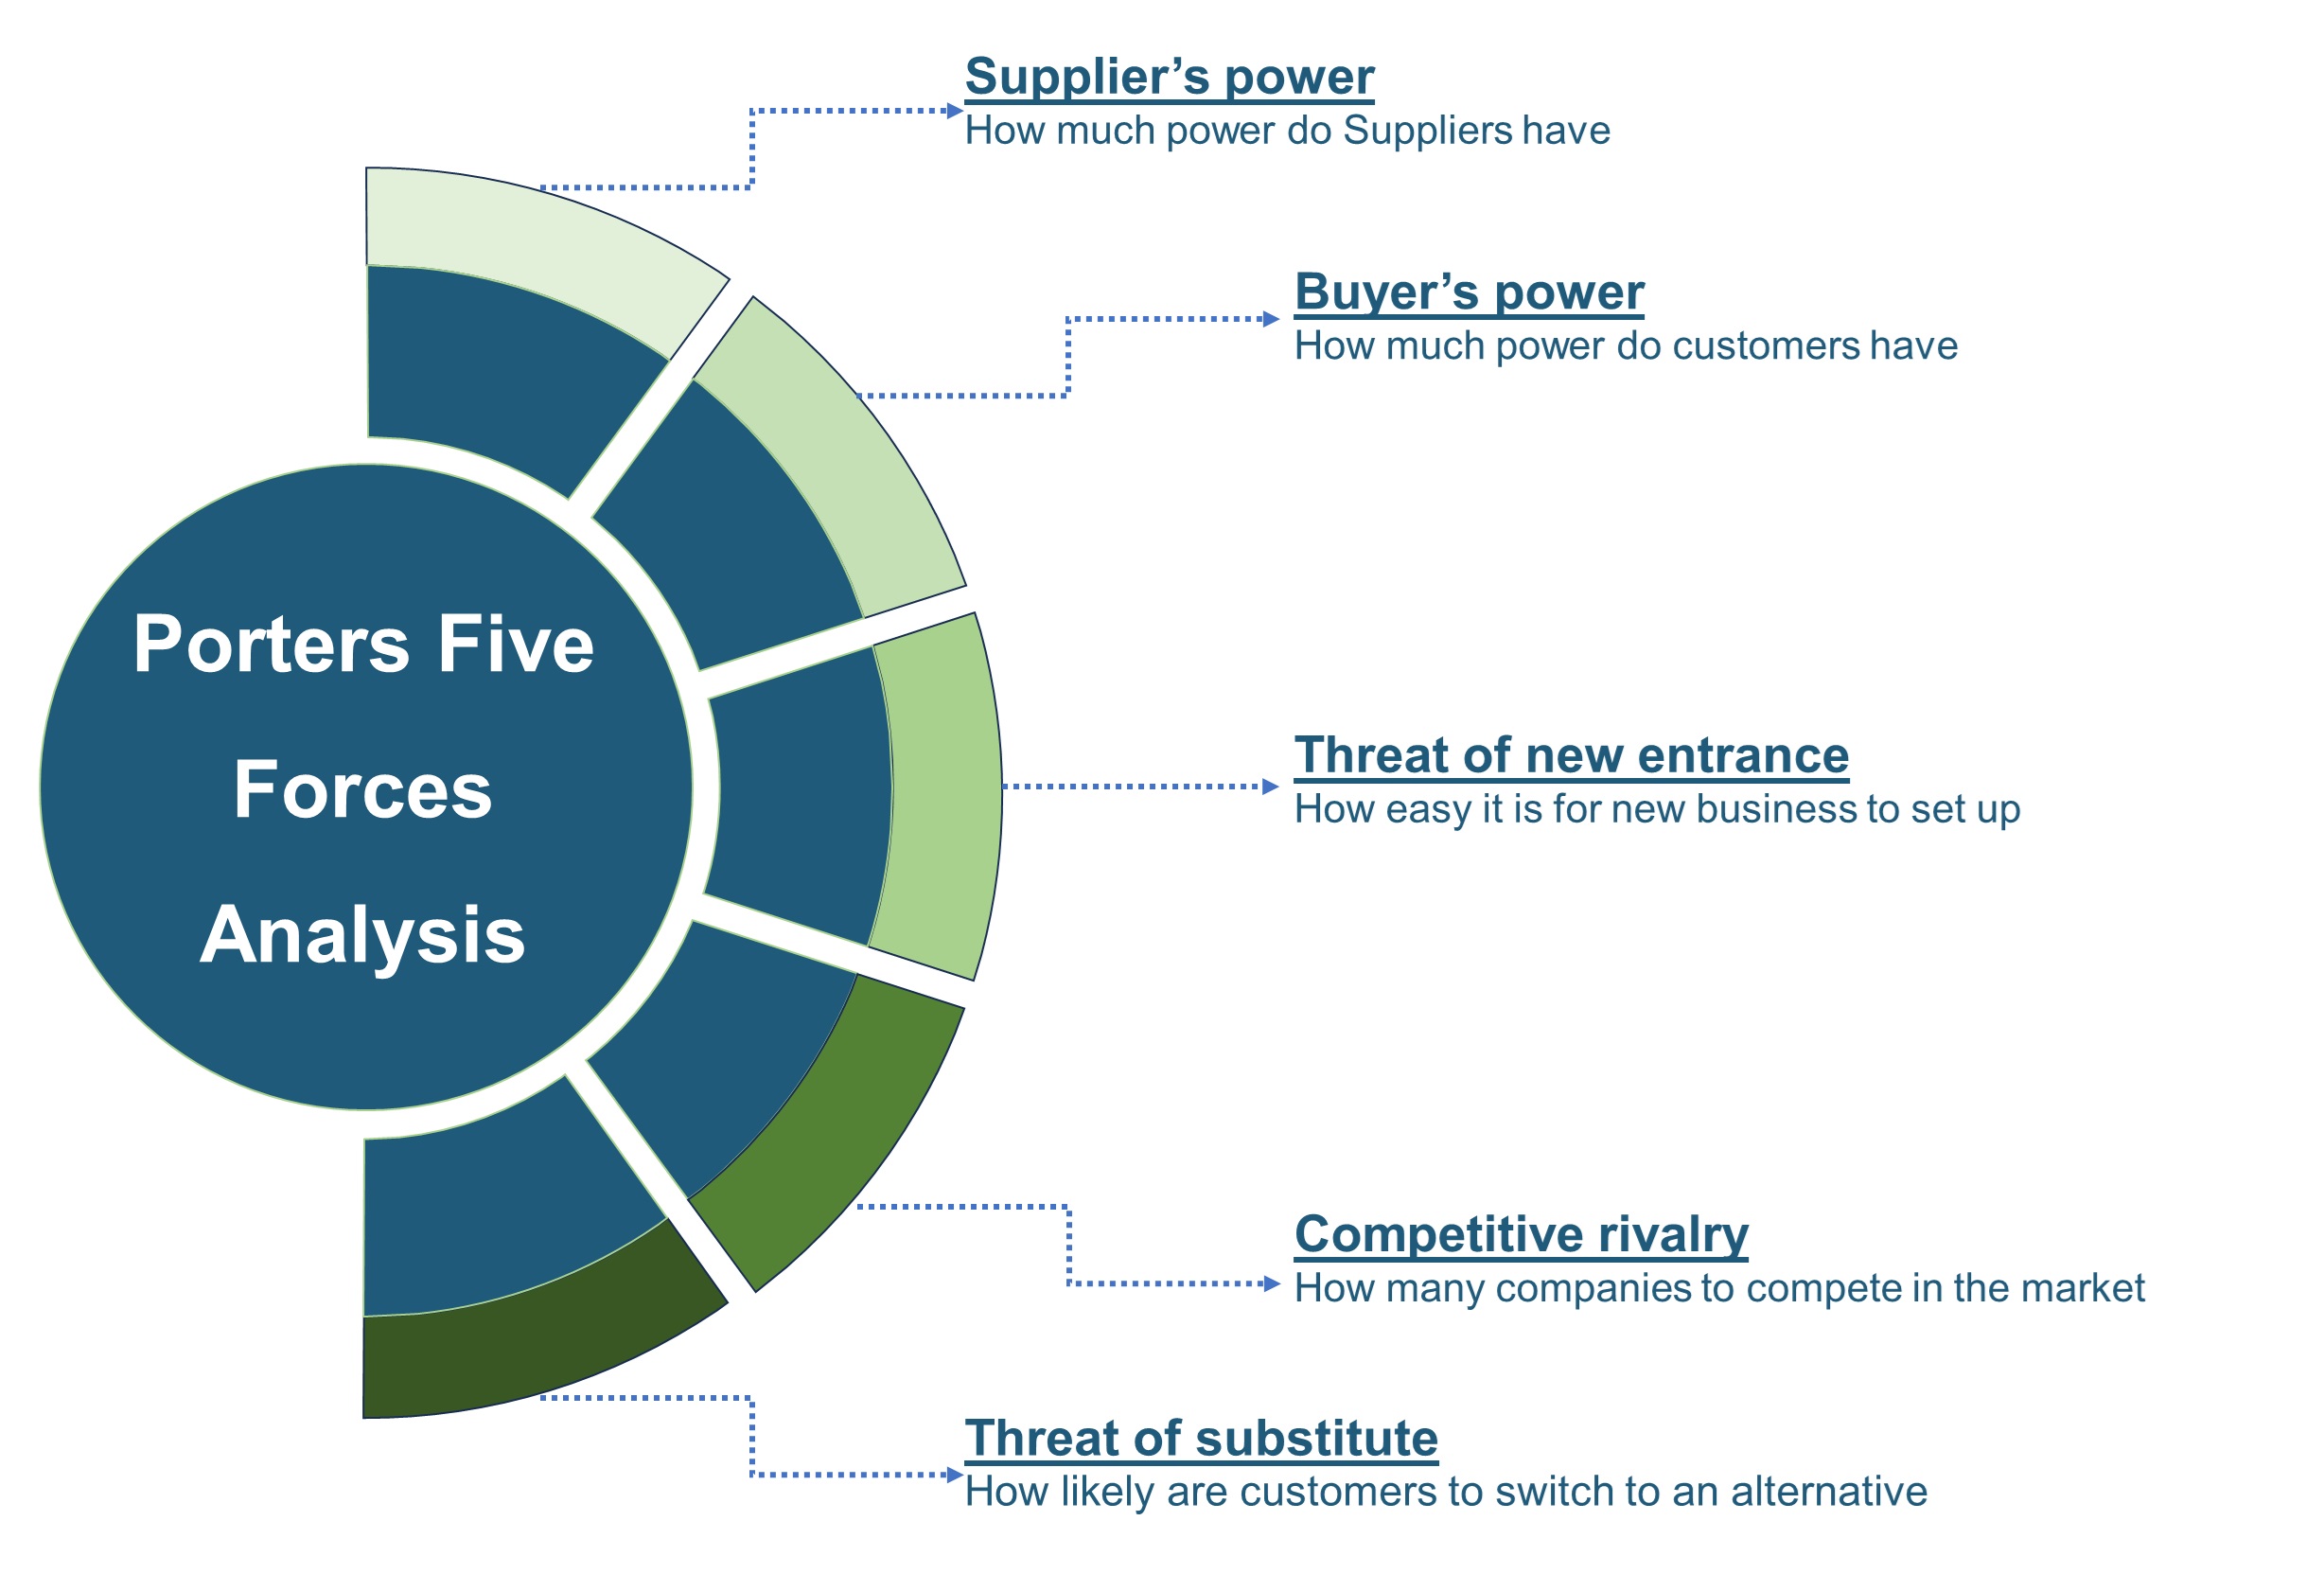
Porters Five Forces Analysis
We conduct Porter's Five Forces analysis to evaluate the competitive landscape of an industry, providing us with insights into factors that affect profitability and strategic positioning.
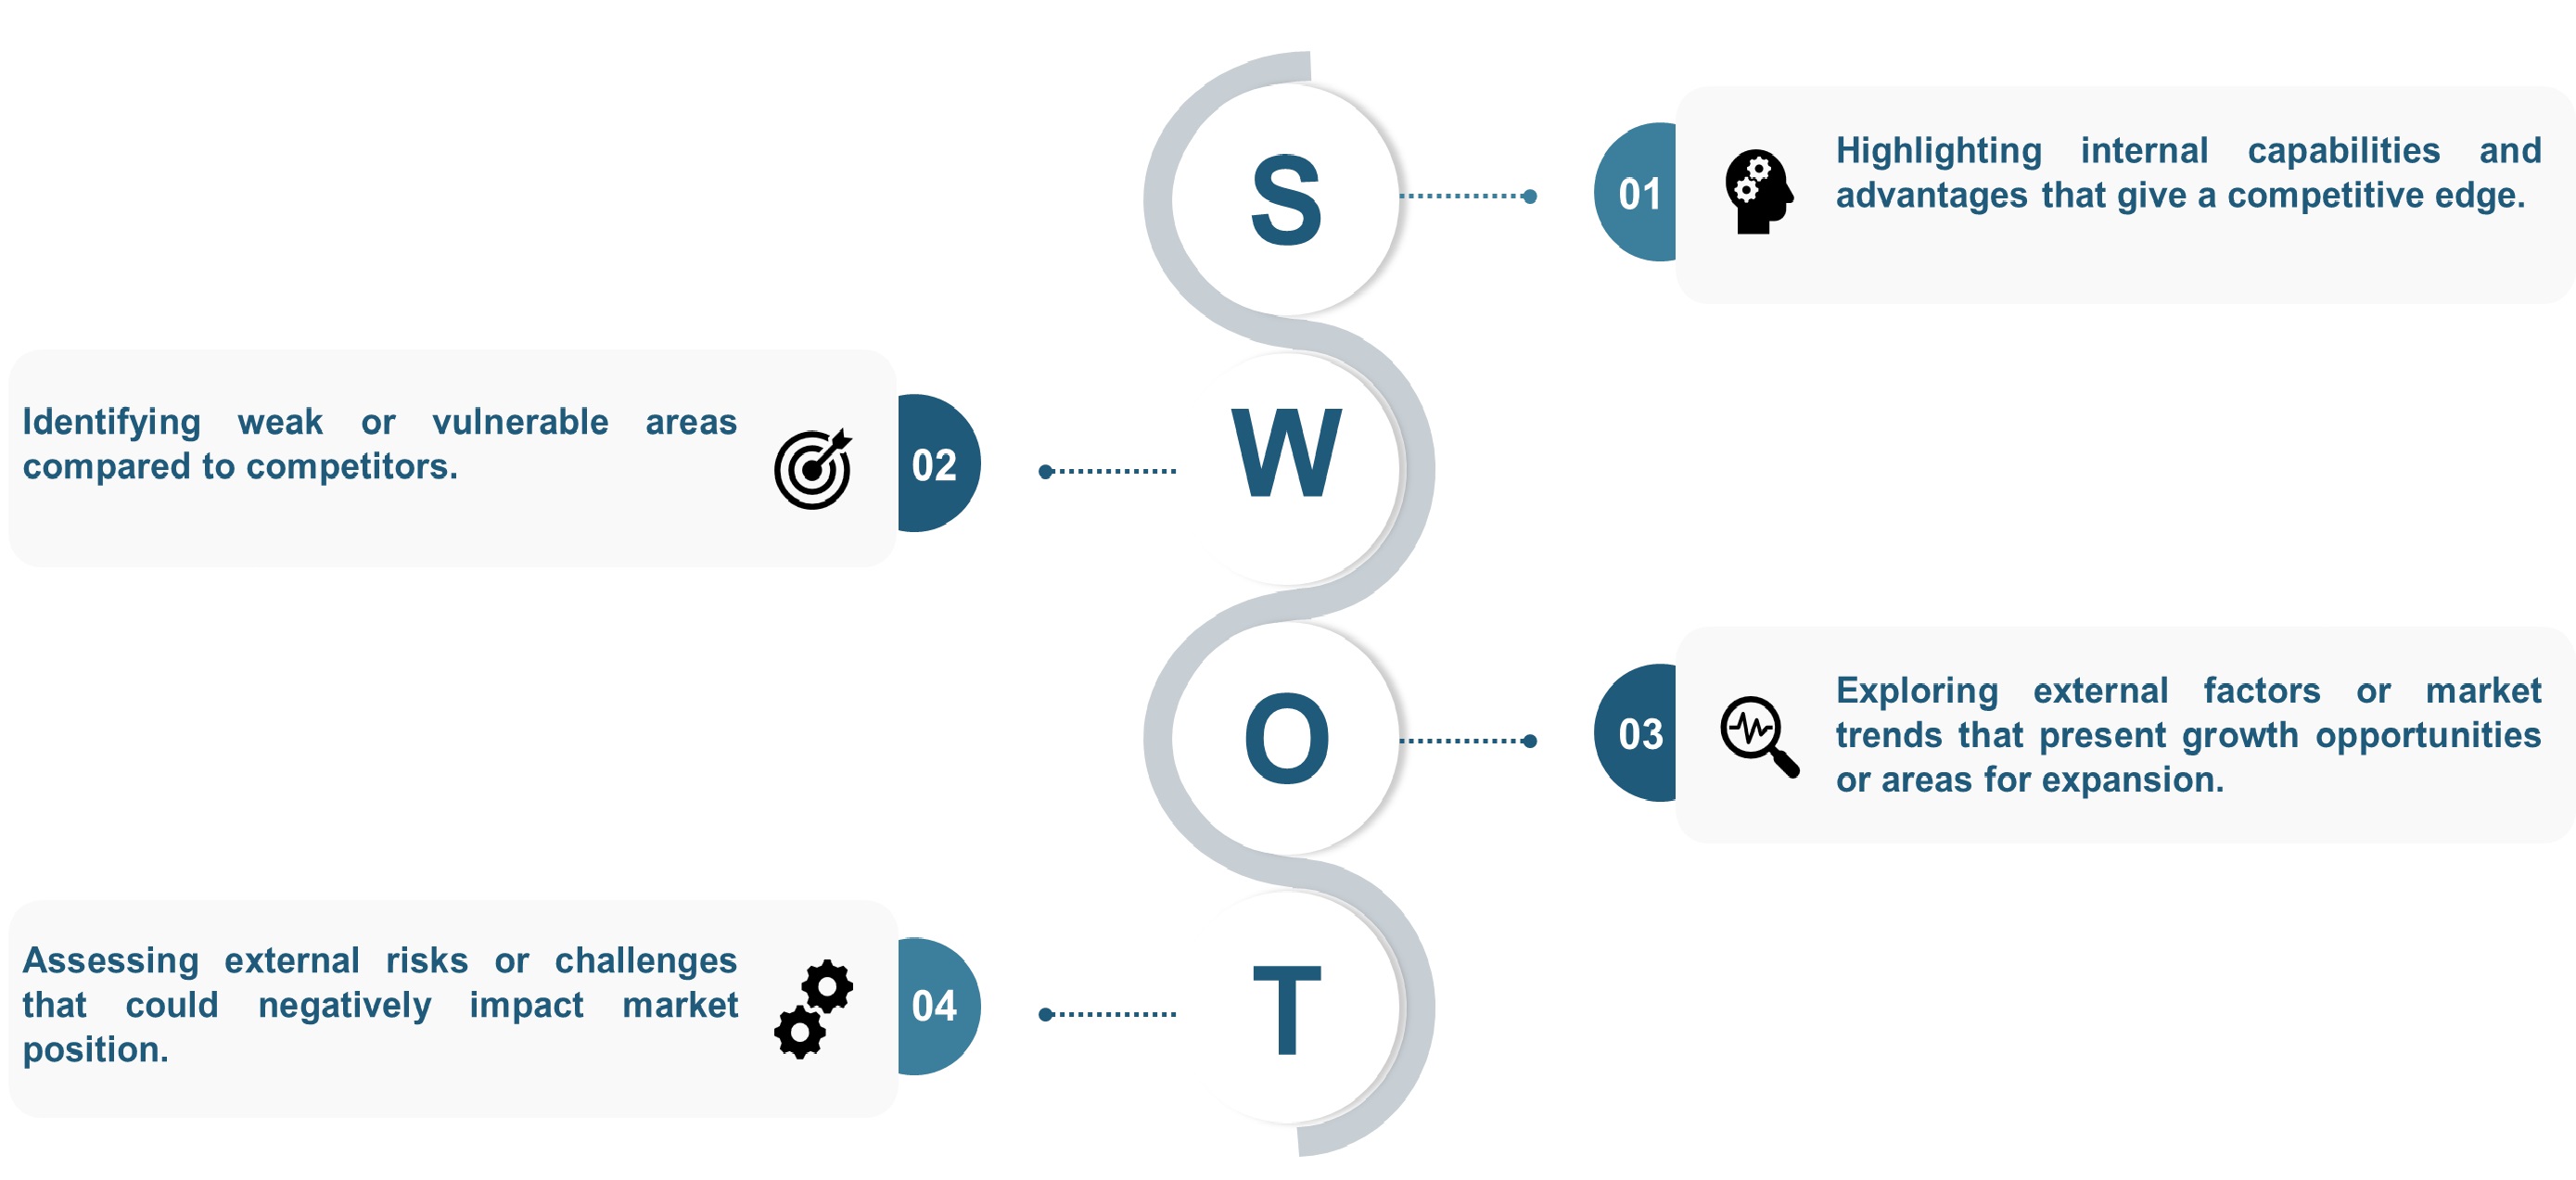
SWOT Analysis
We conduct SWOT analysis to understand market trends, identify potential threats, capitalize on opportunities, and assess our strengths and weaknesses.
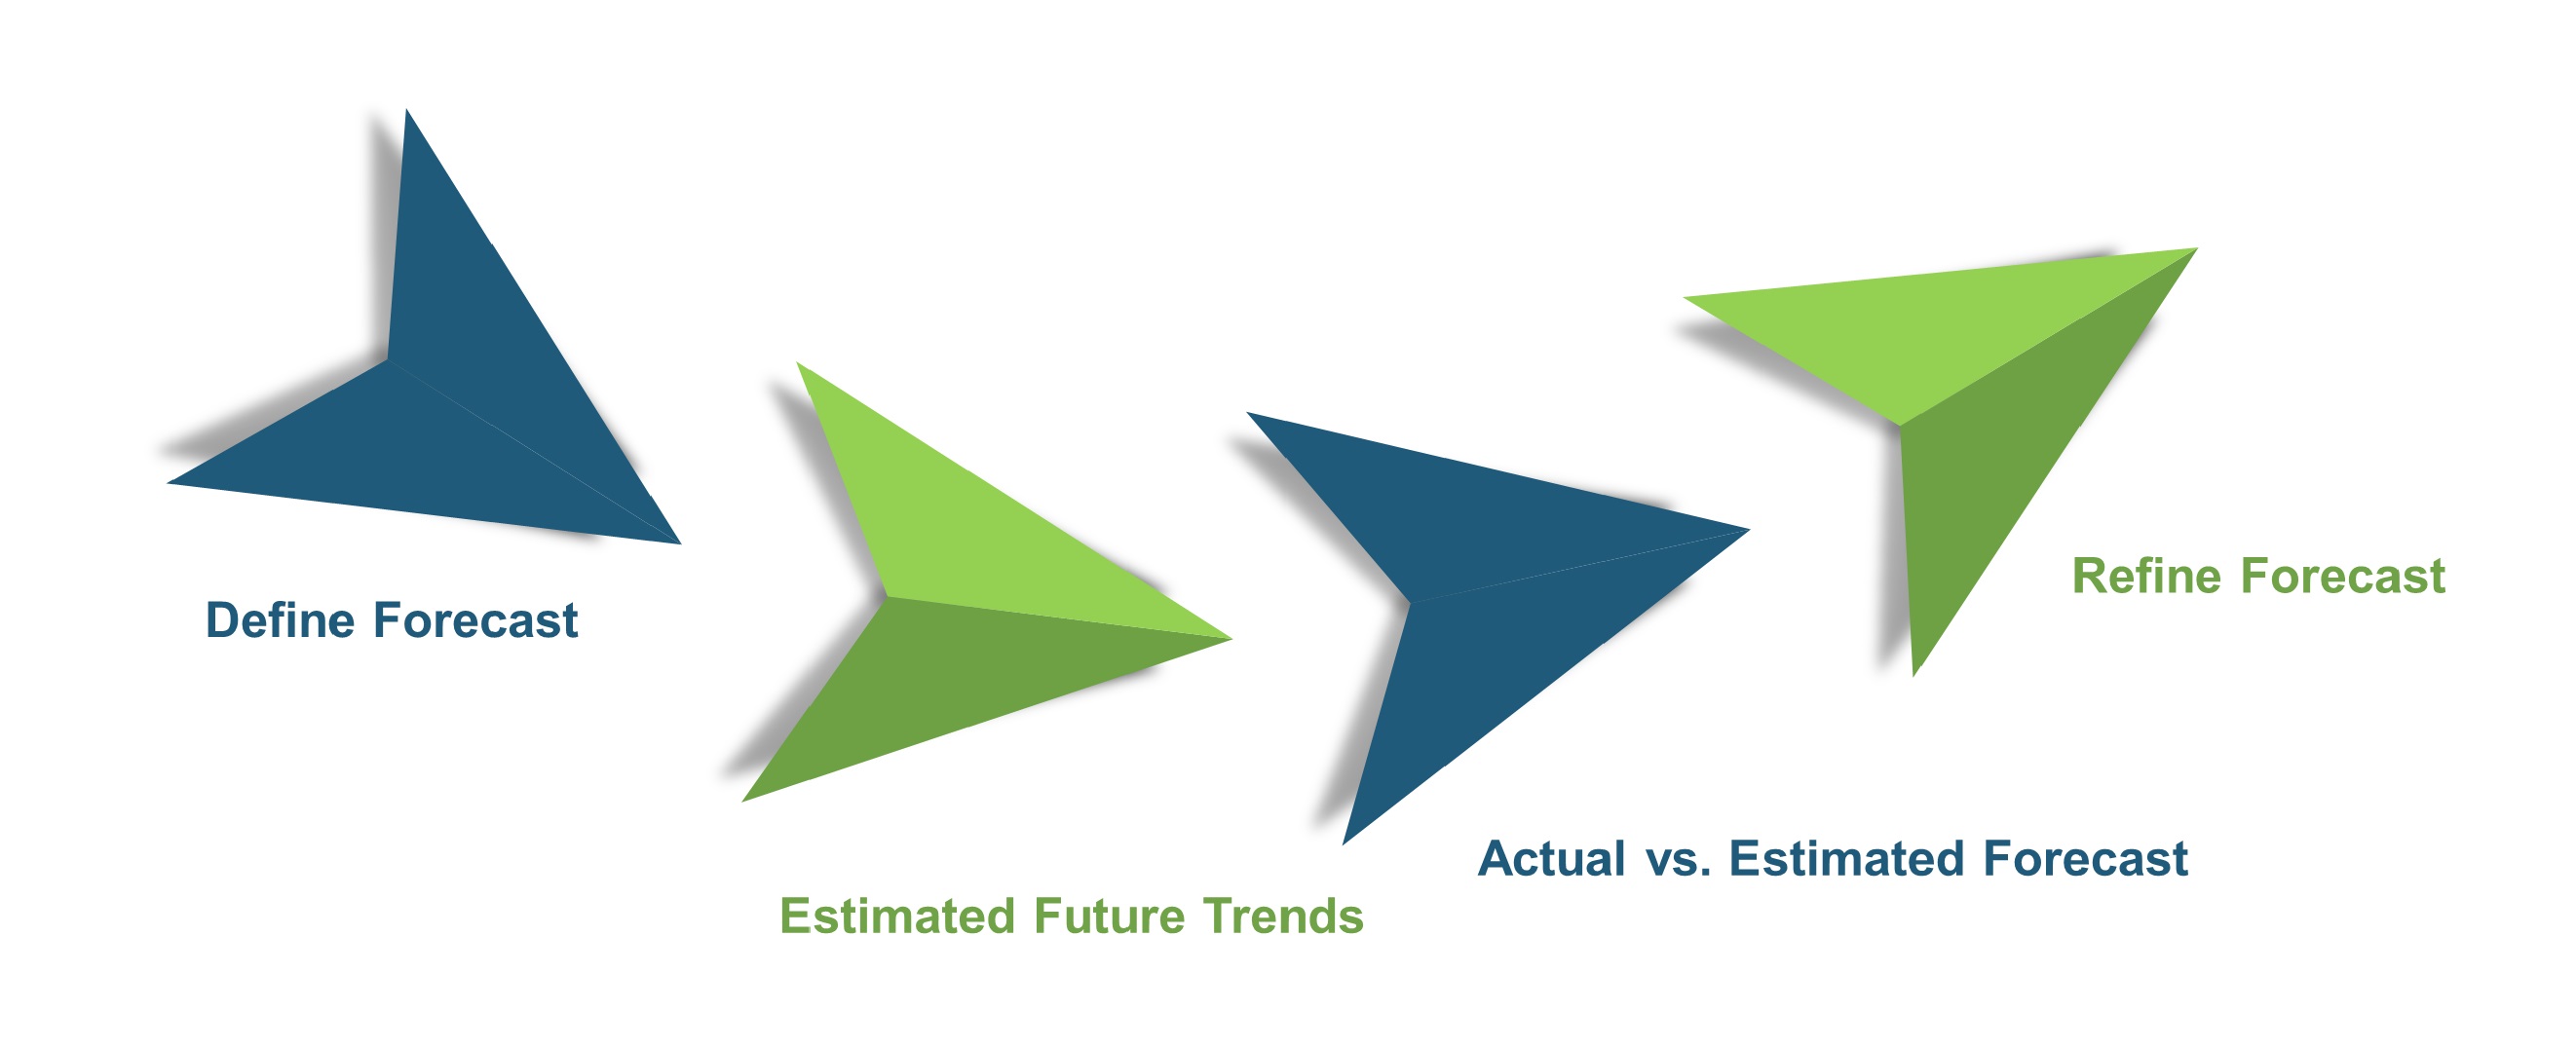
Forecasting
We utilize a forecasting model to predict future consumption by considering parameters like population, economics, regulations, market competition, drivers, constraints, technology, and pricing. We also employ statistical techniques such as multilinear regression, exponential smoothing, moving average, ARIMA, and Monte Carlo simulations for accurate predictions. In econometric forecasting, we analyzed short-term and long-term event impacts, attributing values based on regulatory frameworks, economic factors, and market events.
Download Free Sample
Frequently Asked Questions
 Speak to Our Analyst


Related Report


Related Blogs
The Role of Emerging Tech in 5G Infrastructure
The 5G infrastructure industry is undergoing a paradigm shift, driven by a wave...


Top Fintech Firms Shaping the Mobile Payment Market
The global mobile payment market is expected to grow annually at a rate of 13.5%...

What’s Impacting the Growth of Digital Marketplaces Today?
Digital marketplaces act as intermediaries that facilitate transactions between...