North America Digital Marketplace Market by Platform (Desktop, Mobile, and Tablets), by Model Type (Business to Business (B2B), Business to Consumer (B2C), and Consumer to Consumer (C2C)), and by End Users (Commercial, and Personal)- Opportunity Analysis and Industry Forecast, 2024– 2030
Industry: ICT & Media | Publish Date: 27-Jun-2024 | No of Pages: 153 | No. of Tables: 111 | No. of Figures: 56 | Format: PDF | Report Code : N/A


US Tariff Impact on North America Digital Marketplace Market
Trump Tariffs Are Reshaping Global Business
North America Digital Marketplace Market Overview
The North America Digital Marketplace Market size was valued at USD 122.39 billion in 2023, and is predicted to reach USD 313.40 billion by 2030, at a CAGR of 14.2 % from 2024 to 2030. Digital marketplace market also known as online marketplaces or digital commerce platforms are virtual hubs where individuals looking to buy or sell goods, services, or information come together to conduct transactions. Acting as intermediaries, these platforms streamline exchanges between various parties, such as buyers and sellers, within a centralized online space designed for easy product discovery, purchasing, and delivery. Notable examples of online marketplaces include well-known e-commerce platforms such as Amazon, eBay, and Alibaba, as well as service-oriented platforms such as Upwork and Fiverr.
Leveraging technology, these platforms optimize transaction processes, ensuring efficient and secure payment processing while safeguarding the financial information of all involved parties. Additionally, they enhance user experiences by offering features such as customer reviews, ratings, and mechanisms for resolving transaction-related issues. Consequently, online marketplaces utilize technology to enhance the overall online commerce experience, making it simpler and safer for both buyers and sellers. They play a crucial role in today's economy by bridging the gap between businesses and consumers across geographical boundaries, thereby enabling smooth and convenient global commerce.
Technological Advancements Propels the Market Growth
The continual advancement of technology serves as a primary driver of digital marketplaces market growth in North America. With the proliferation of high-speed internet, the widespread adoption of smartphones, and the development of secure online payment systems, the infrastructure necessary for robust digital marketplaces become increasingly accessible. These technological advancements lowered barriers to entry for both buyers and sellers, facilitating participation in online commerce.
Furthermore, innovations such as artificial intelligence, data analytics, and machine learning enabled online marketplaces to personalize user experiences, optimize search algorithms, and enhance fraud detection mechanisms, thereby improving efficiency and trust within the virtual marketplace ecosystem. As technology continues to evolve, digital marketplaces in North America are poised to capitalize on emerging trends such as augmented reality shopping experiences, voice-activated commerce, and blockchain-based transactions, further driving growth and innovation in the digital marketplace sector.
Shifting of Consumer Behaviour Towards Online Shopping Drives the Market Growth
Shifting consumer preferences and behaviors also play a significant role in driving the growth of digital marketplaces in North America. Increasingly busy lifestyles, coupled with the convenience and variety offered by online shopping, led consumers to favor digital channels over traditional brick-and-mortar retail. The COVID-19 pandemic further accelerated this trend as lockdowns and social distancing measures prompted a surge in online shopping activity.
Additionally, younger generations, particularly Millennials and Gen Z, exhibit a strong inclination towards digital-first experiences, preferring the convenience, transparency, and social aspects of online marketplaces. As a result, businesses in North America are compelled to establish a strong digital presence and adapt their strategies to meet evolving consumer demands, driving the proliferation of digital marketplaces, catering to a wide range of products and services.
Cybersecurity Threats and Concerns Regarding Consumer Trust Within Digital Marketplaces Pose Obstacles to the Market Expansion
Cybersecurity threats, including data breaches and fraudulent activities, present significant challenges to digital marketplaces by compromising consumer trust. When consumers perceive online platforms as susceptible to cyberattacks, they refrain from sharing personal information or engaging in transactions online due to concerns about privacy breaches or financial harm.
This loss of trust result in decreased usage of online marketplaces and reluctance to participate in online shopping endeavors, thereby impeding market expansion. Furthermore, occurrences of data breaches or fraudulent behavior tarnish the reputation of digital commercial platforms, dissuading both consumers and businesses from active involvement in the digital marketplace environment.
Integration of Augmented Reality (AR) and Virtual Reality (VR) Technologies Presents Opportunity for Market Expansion
The incorporation of Augmented Reality (AR) and Virtual Reality (VR) technologies into online marketplaces is poised to generate lucrative opportunities in the market. By harnessing AR and VR, digital marketplaces provide users with more immersive and captivating shopping experiences. These technologies allow consumers to visualize products in real-world contexts, virtually test them before making a purchase, and explore interactive virtual environments.
Such immersive experiences not only enhance customer engagement and foster brand loyalty but also drive sales. Furthermore, AR and VR empower businesses to showcase their products more effectively by offering detailed information and personalized recommendations to users. Thus, the integration of AR and VR technologies holds significant potential to transform the future landscape of digital commerce platforms by delivering innovative and compelling internet shopping experiences.
U.S. Holds the Dominant Share in the North America Digital Marketplace Market
The U.S. asserts a dominant position in the digital commerce platforms market, primarily due to the flourishing e-commerce industry within this region. As per the International Trade Administration, the U.S. e-commerce sector is projected to witness a compound annual growth rate of 11.22% by 2027.
With a significant shift towards online shopping among consumers, there arises an escalating demand for convenient platforms offering a diverse array of products and services from various sellers. Digital marketplaces act as centralized hubs facilitating connections between businesses and consumers, thereby simplifying transactions and broadening market reach. The surge in e-commerce activities sets the stage for digital marketplaces to thrive, offering opportunities for businesses of all scales to penetrate new markets and bolster their online presence.
With the continued momentum of e-commerce, the digital commerce platforms market is poised for sustained expansion, buoyed by evolving consumer preferences and advancements in technology. Furthermore, the rising adoption of smartphones in the U.S. serves as another catalyst propelling the growth of the digital commerce platforms market. With an increasing number of consumers accessing the internet through their mobile devices, there emerges a heightened demand for user-friendly platforms providing seamless access to shopping opportunities.
Digital marketplaces cater to this trend by offering mobile-responsive interfaces and applications, enabling users to effortlessly browse, compare, and purchase products and services. The ubiquity of smartphones empowers consumers to engage with online marketplaces at their convenience, regardless of time or location, thus enhancing overall accessibility and convenience.
According to Gitnux, a global commerce media LLC company, smartphone penetration in the U.S. is forecasted to reach 81.5% of the population by 2024. As smartphone adoption continues to rise, the digital commerce platforms market is poised for sustained growth, driven by the increasing reliance on mobile technology for various daily activities, including shopping.
Mexico to Witness Substantial Growth in the North America Digital Marketplace Market
Mexico is poised for significant growth in the market, with projections indicating the highest Compound Annual Growth Rate (CAGR). This growth is primarily attributed to the widespread adoption of payment platforms within the region. As more consumers in Mexico embrace digital payment methods for their convenience and security, there is a growing demand for seamless and reliable payment solutions within online marketplaces.
These platforms consists of the opportunity to collaborate with payment providers to offer a diverse range of payment options, including credit/debit cards, mobile wallets, and alternative methods. By integrating robust payment infrastructure, online marketplaces can enhance the user experience, streamline transactions, and drive higher conversion rates.
For example, in October 2022, Adyen introduced a payment platform in Mexico aimed at facilitating online, in-store, and in-app transactions through a single platform. This platform also connects businesses with key domestic and international banks to expedite card payments and gain valuable insights.
As payment platforms continue to expand their footprint in Mexico, they will play a pivotal role in fueling the growth and success of the online marketplaces market, unlocking new opportunities for commerce and innovation in the digital economy.
Moreover, the burgeoning population in Mexico contributes to the growth of the digital marketplaces market within the region. The expanding population drives an increase in consumer demand for goods and services, prompting businesses to bolster their online presence through digital commerce platforms.
These platforms offer a convenient and accessible avenue for consumers to explore, compare, and purchase products from a diverse array of sellers. According to data from the United Nations Population Fund in 2024, Mexico's total population stands at 129.4 million. This demographic surge amplifies the demand for online shopping, thereby fostering the North America digital marketplaces market growth.
Competitive Landscape
The key market players operating in the North America digital marketplace industry include Amazon.com, Inc., Walmart Inc., eBay Inc., Alibaba Group Holding Limited, Rakuten Group, Inc., Sea Limited, MercadoLibre, Inc., JD.com, Inc., Etsy, Inc., Allegro.eu, Kogan.com, SEEK, Carsales, REA Group Ltd., Airtasker Ltd. and others.
North America Digital Marketplace Market Key Segments
By Platform
-
Desktop
-
Mobile
-
Tablets
By Model Type
-
Business to Business (B2B)
-
Business to Consumer (B2C)
-
Consumer to Consumer (C2C)
By End-User
-
Commercial
-
Personal
By Country
-
U.S.
-
Canada
-
Mexico
REPORT SCOPE AND SEGMENTATION:
|
Parameters |
Details |
|
Market Size in 2023 |
USD 122.39 Billion |
|
Revenue Forecast in 2030 |
USD 313.40 Billion |
|
Growth Rate |
CAGR of 14.2% from 2024 to 2030 |
|
Analysis Period |
2023–2030 |
|
Base Year Considered |
2023 |
|
Forecast Period |
2024–2030 |
|
Market Size Estimation |
Billion (USD) |
|
Growth Factors |
|
|
Countries Covered |
3 |
|
Companies Profiled |
15 |
|
Market Share |
Available for 10 companies |
|
Customization Scope |
Free customization (equivalent up to 80 working hours of analysts) after purchase. Addition or alteration to country, regional, and segment scope. |
|
Pricing and Purchase Options |
Avail customized purchase options to meet your exact research needs. |
KEY PLAYERS
-
Amazon.com, Inc.
-
Walmart Inc.
-
eBay Inc.
-
Alibaba Group Holding Limited
-
Rakuten Group, Inc.
-
Sea Limited
-
MercadoLibre, Inc.
-
JD.com, Inc.
-
Etsy, Inc.
-
Allegro.eu
-
Kogan.com
-
SEEK
-
Carsales
-
REA Group Ltd.
-
Airtasker Ltd.


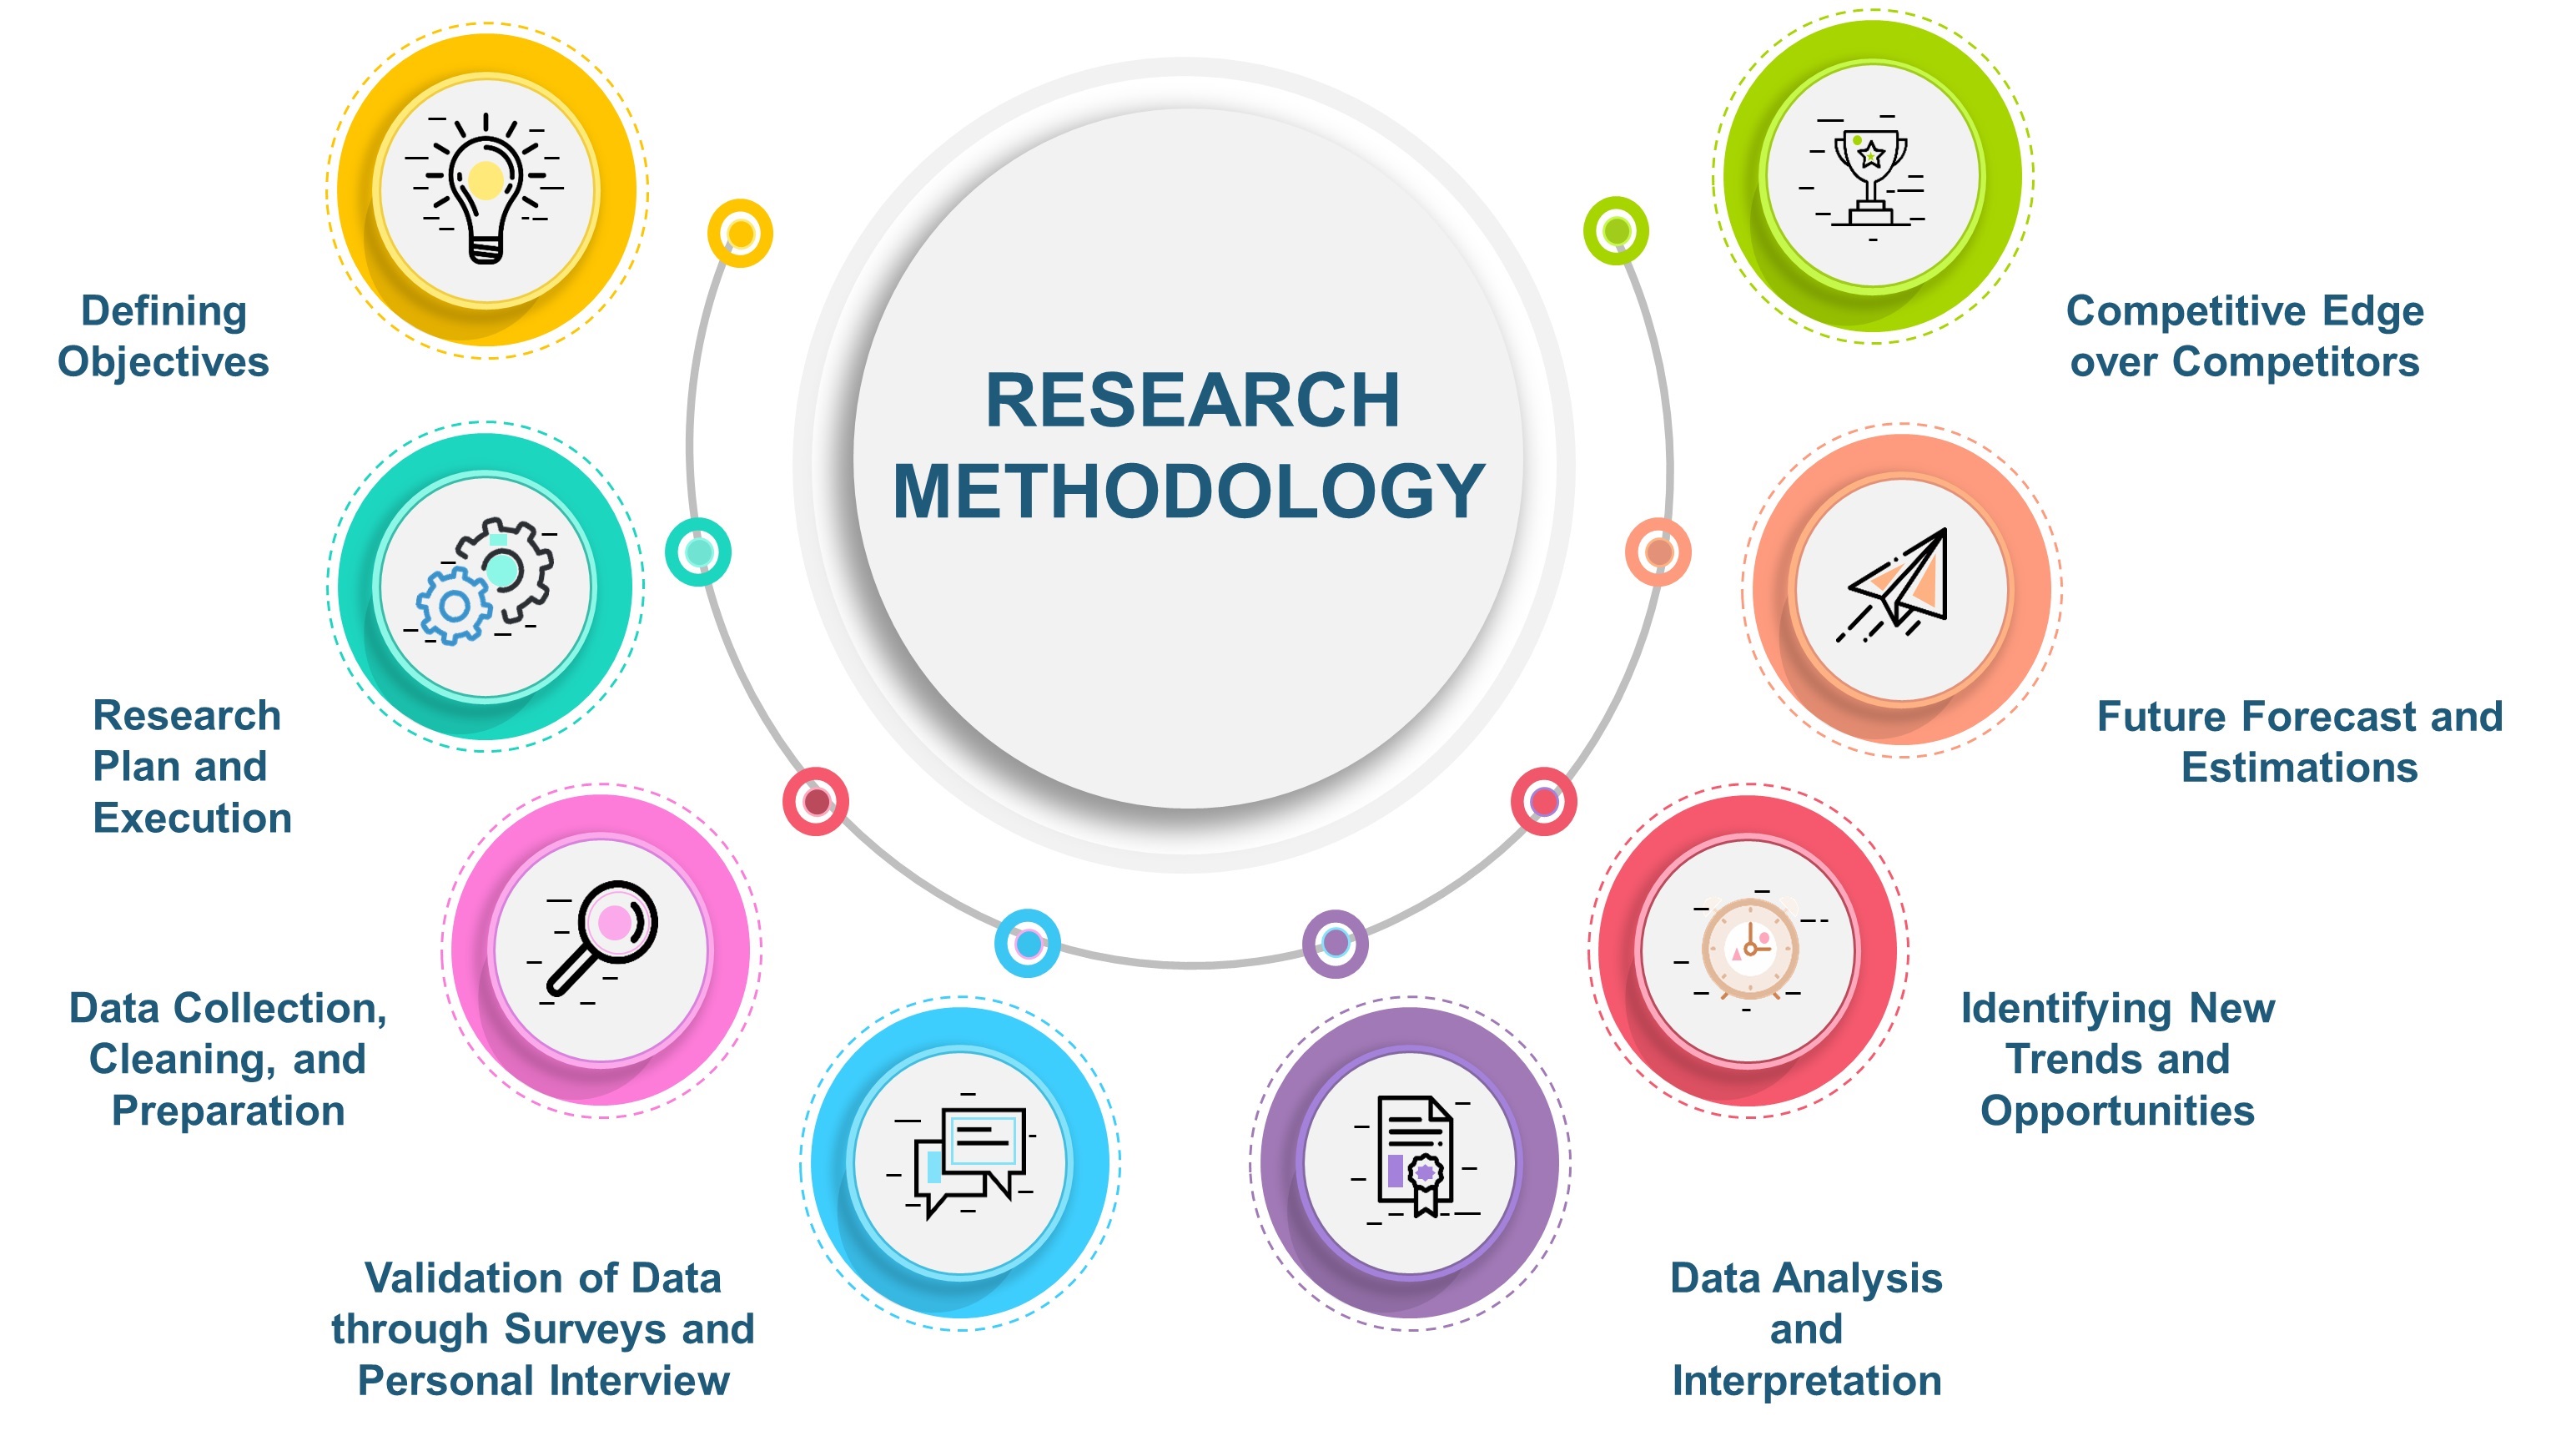
At Next Move Strategy Consulting, we understand that insightful market research is the cornerstone of successful business decisions. That's why we employ a robust and multifaceted approach, combining various methodologies to deliver the most accurate and actionable data for our clients.
Research Landscape
We navigate the world of research with two primary approaches:
Qualitative Approach
Our qualitative research methodologies involve immersive techniques such as in-depth interviews, focus groups, and observational studies. By engaging directly with individuals and stakeholders, we uncover valuable insights that quantitative data alone may overlook.
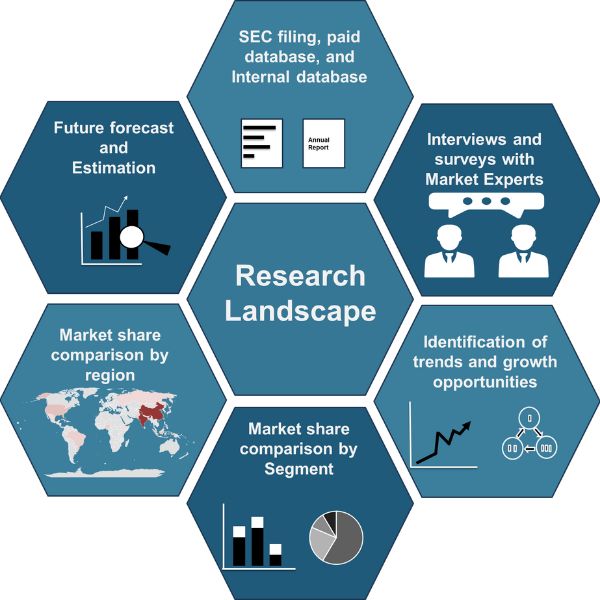
Quantitative Research
In tandem with qualitative methodologies, NMSC leverages the power of Quantitative Research to provide a robust foundation of numerical insights. Through systematic data collection and analysis, we quantify patterns, preferences, and market trends, offering a comprehensive view of the business landscape.
Our quantitative research approach employs diverse tools, including surveys, experiments, and statistical modelling. These methodologies enable us to gather data from a large and representative sample, ensuring the statistical significance of our findings. By employing structured questionnaires and standardized data collection methods, we guarantee the reliability and validity of the information we present to our clients.
Quantitative research is particularly effective in measuring the prevalence of trends, assessing market size, and gauging the impact of various factors on consumer behavior. The numerical precision attained through this approach equips our clients with actionable insights, facilitating data-driven decision-making and strategy formulation.
Our Specialized Toolbox for Industry-Specific Market Research
We deploy a specialized arsenal of techniques tailored to meet your unique requirements. Here's a glimpse into our comprehensive toolbox:

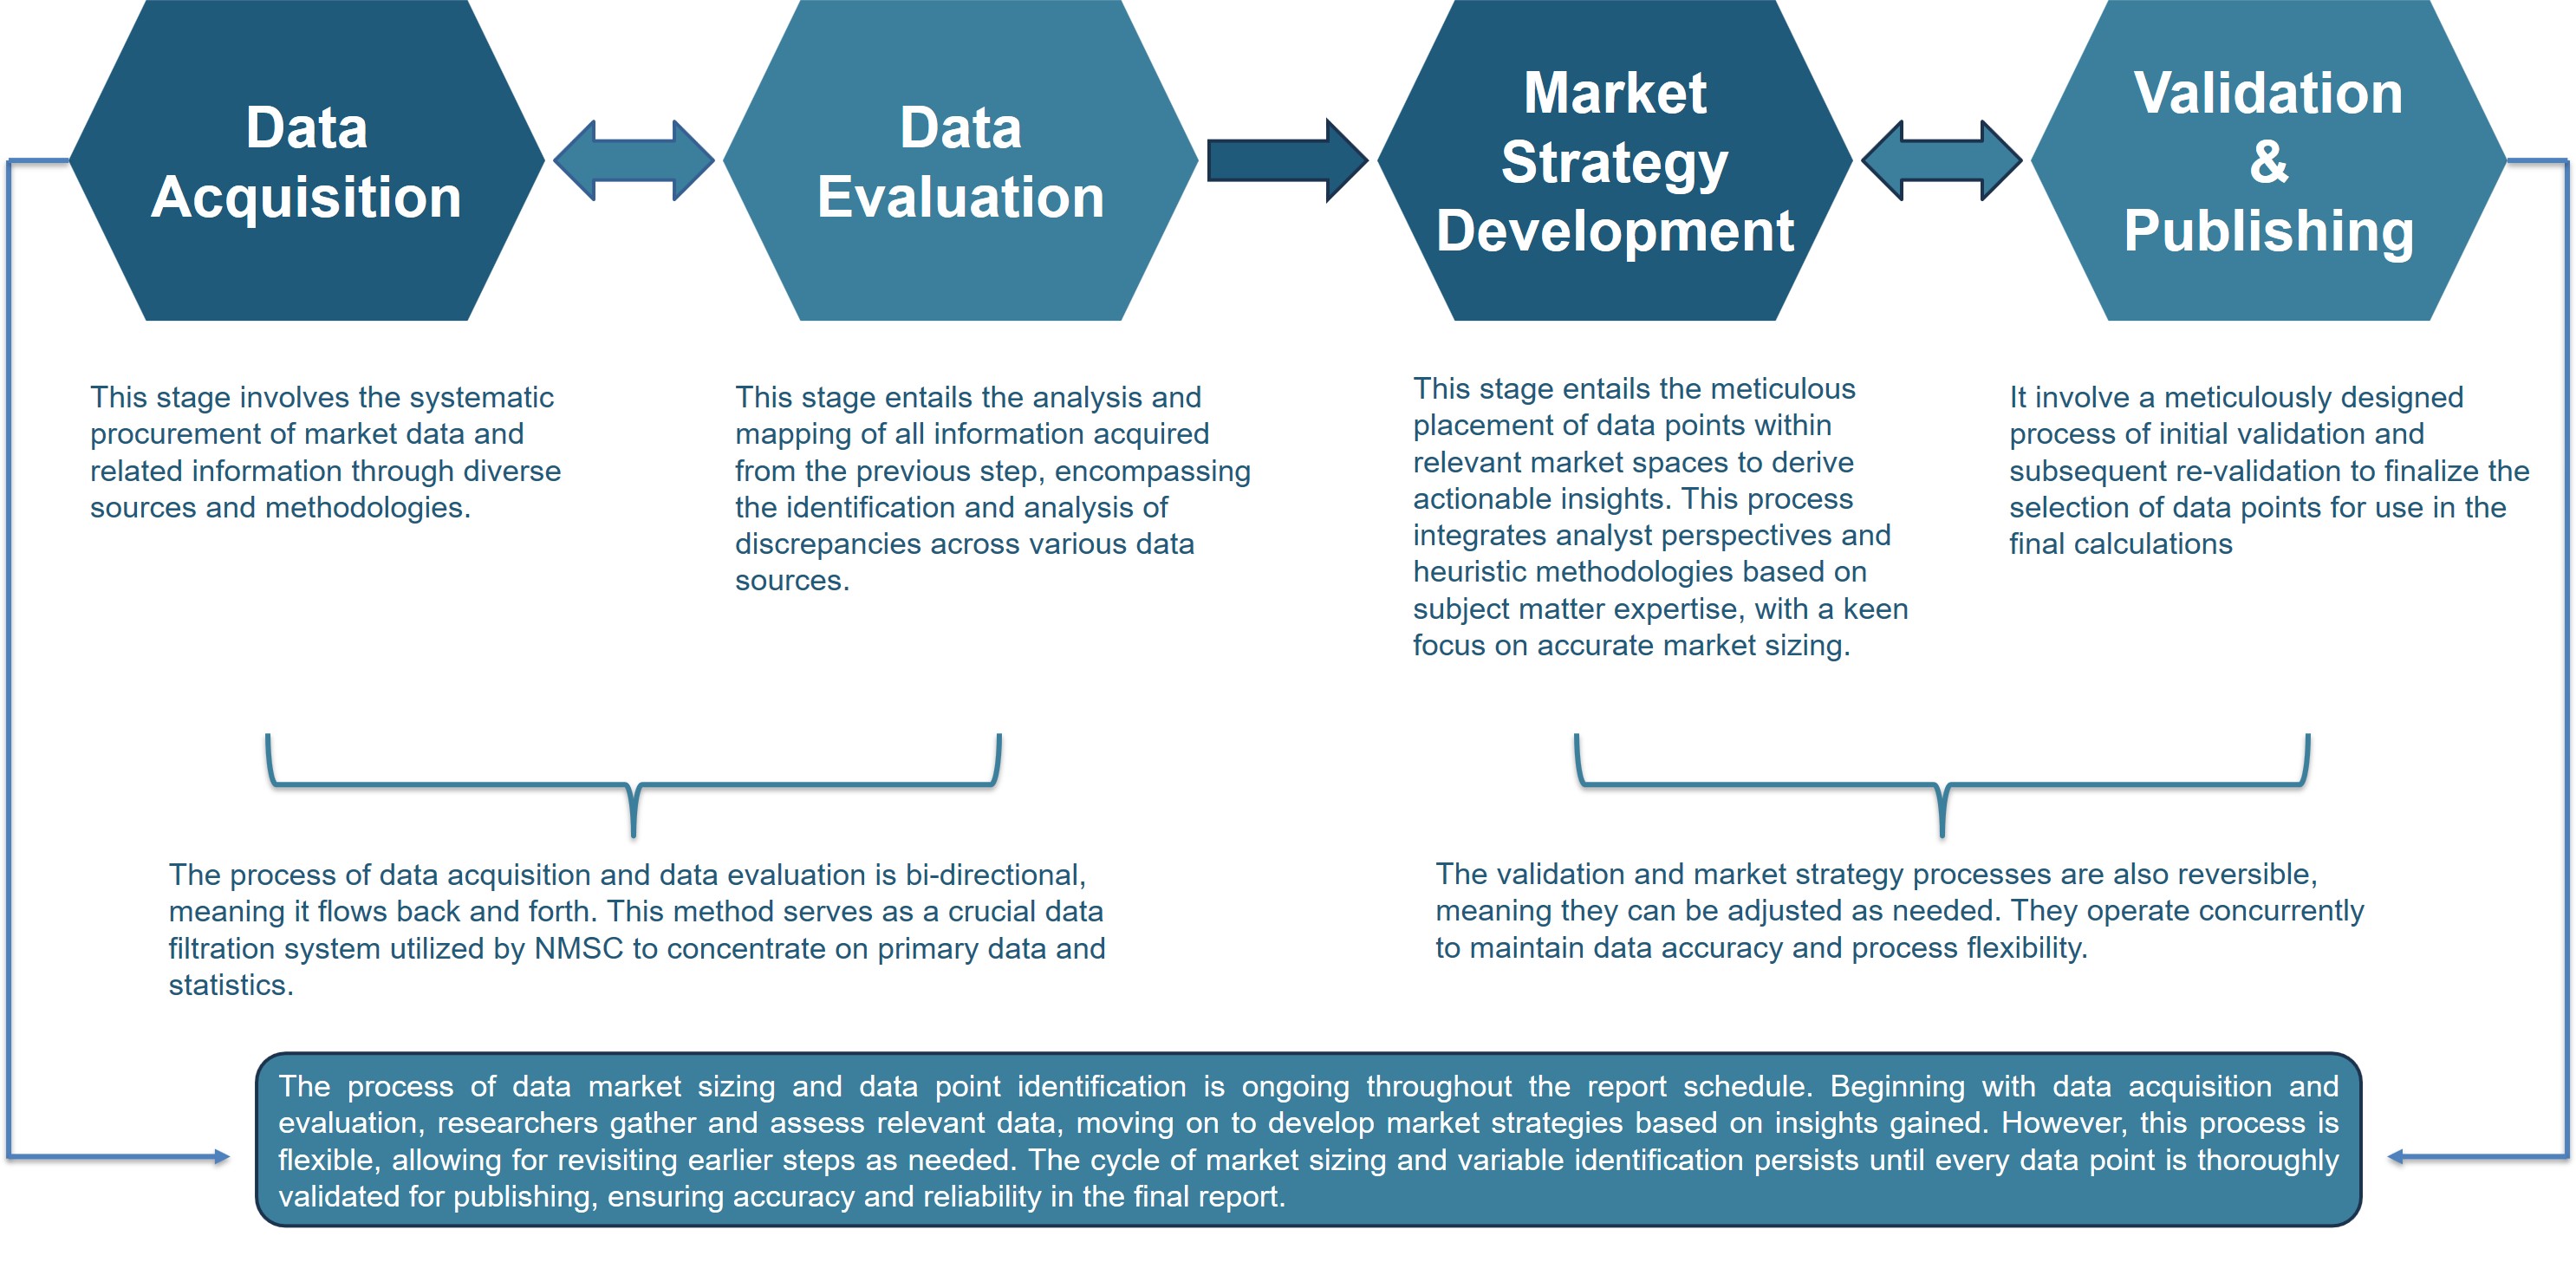
Information Procurement
The stage entails acquiring market data or relevant information through various sources and methodologies.


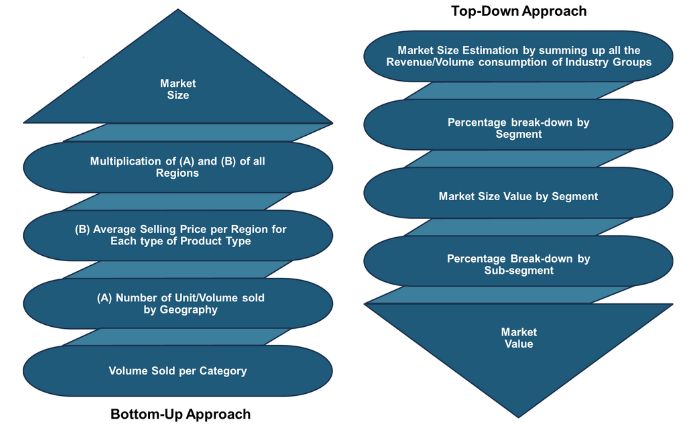
Market Research Approach
We utilize both top-down and bottom-up approaches in market research analysis to achieve a comprehensive understanding of the market dynamics, leveraging the broad perspective of industry trends and macroeconomic factors alongside detailed insights from specific segments and individual companies.
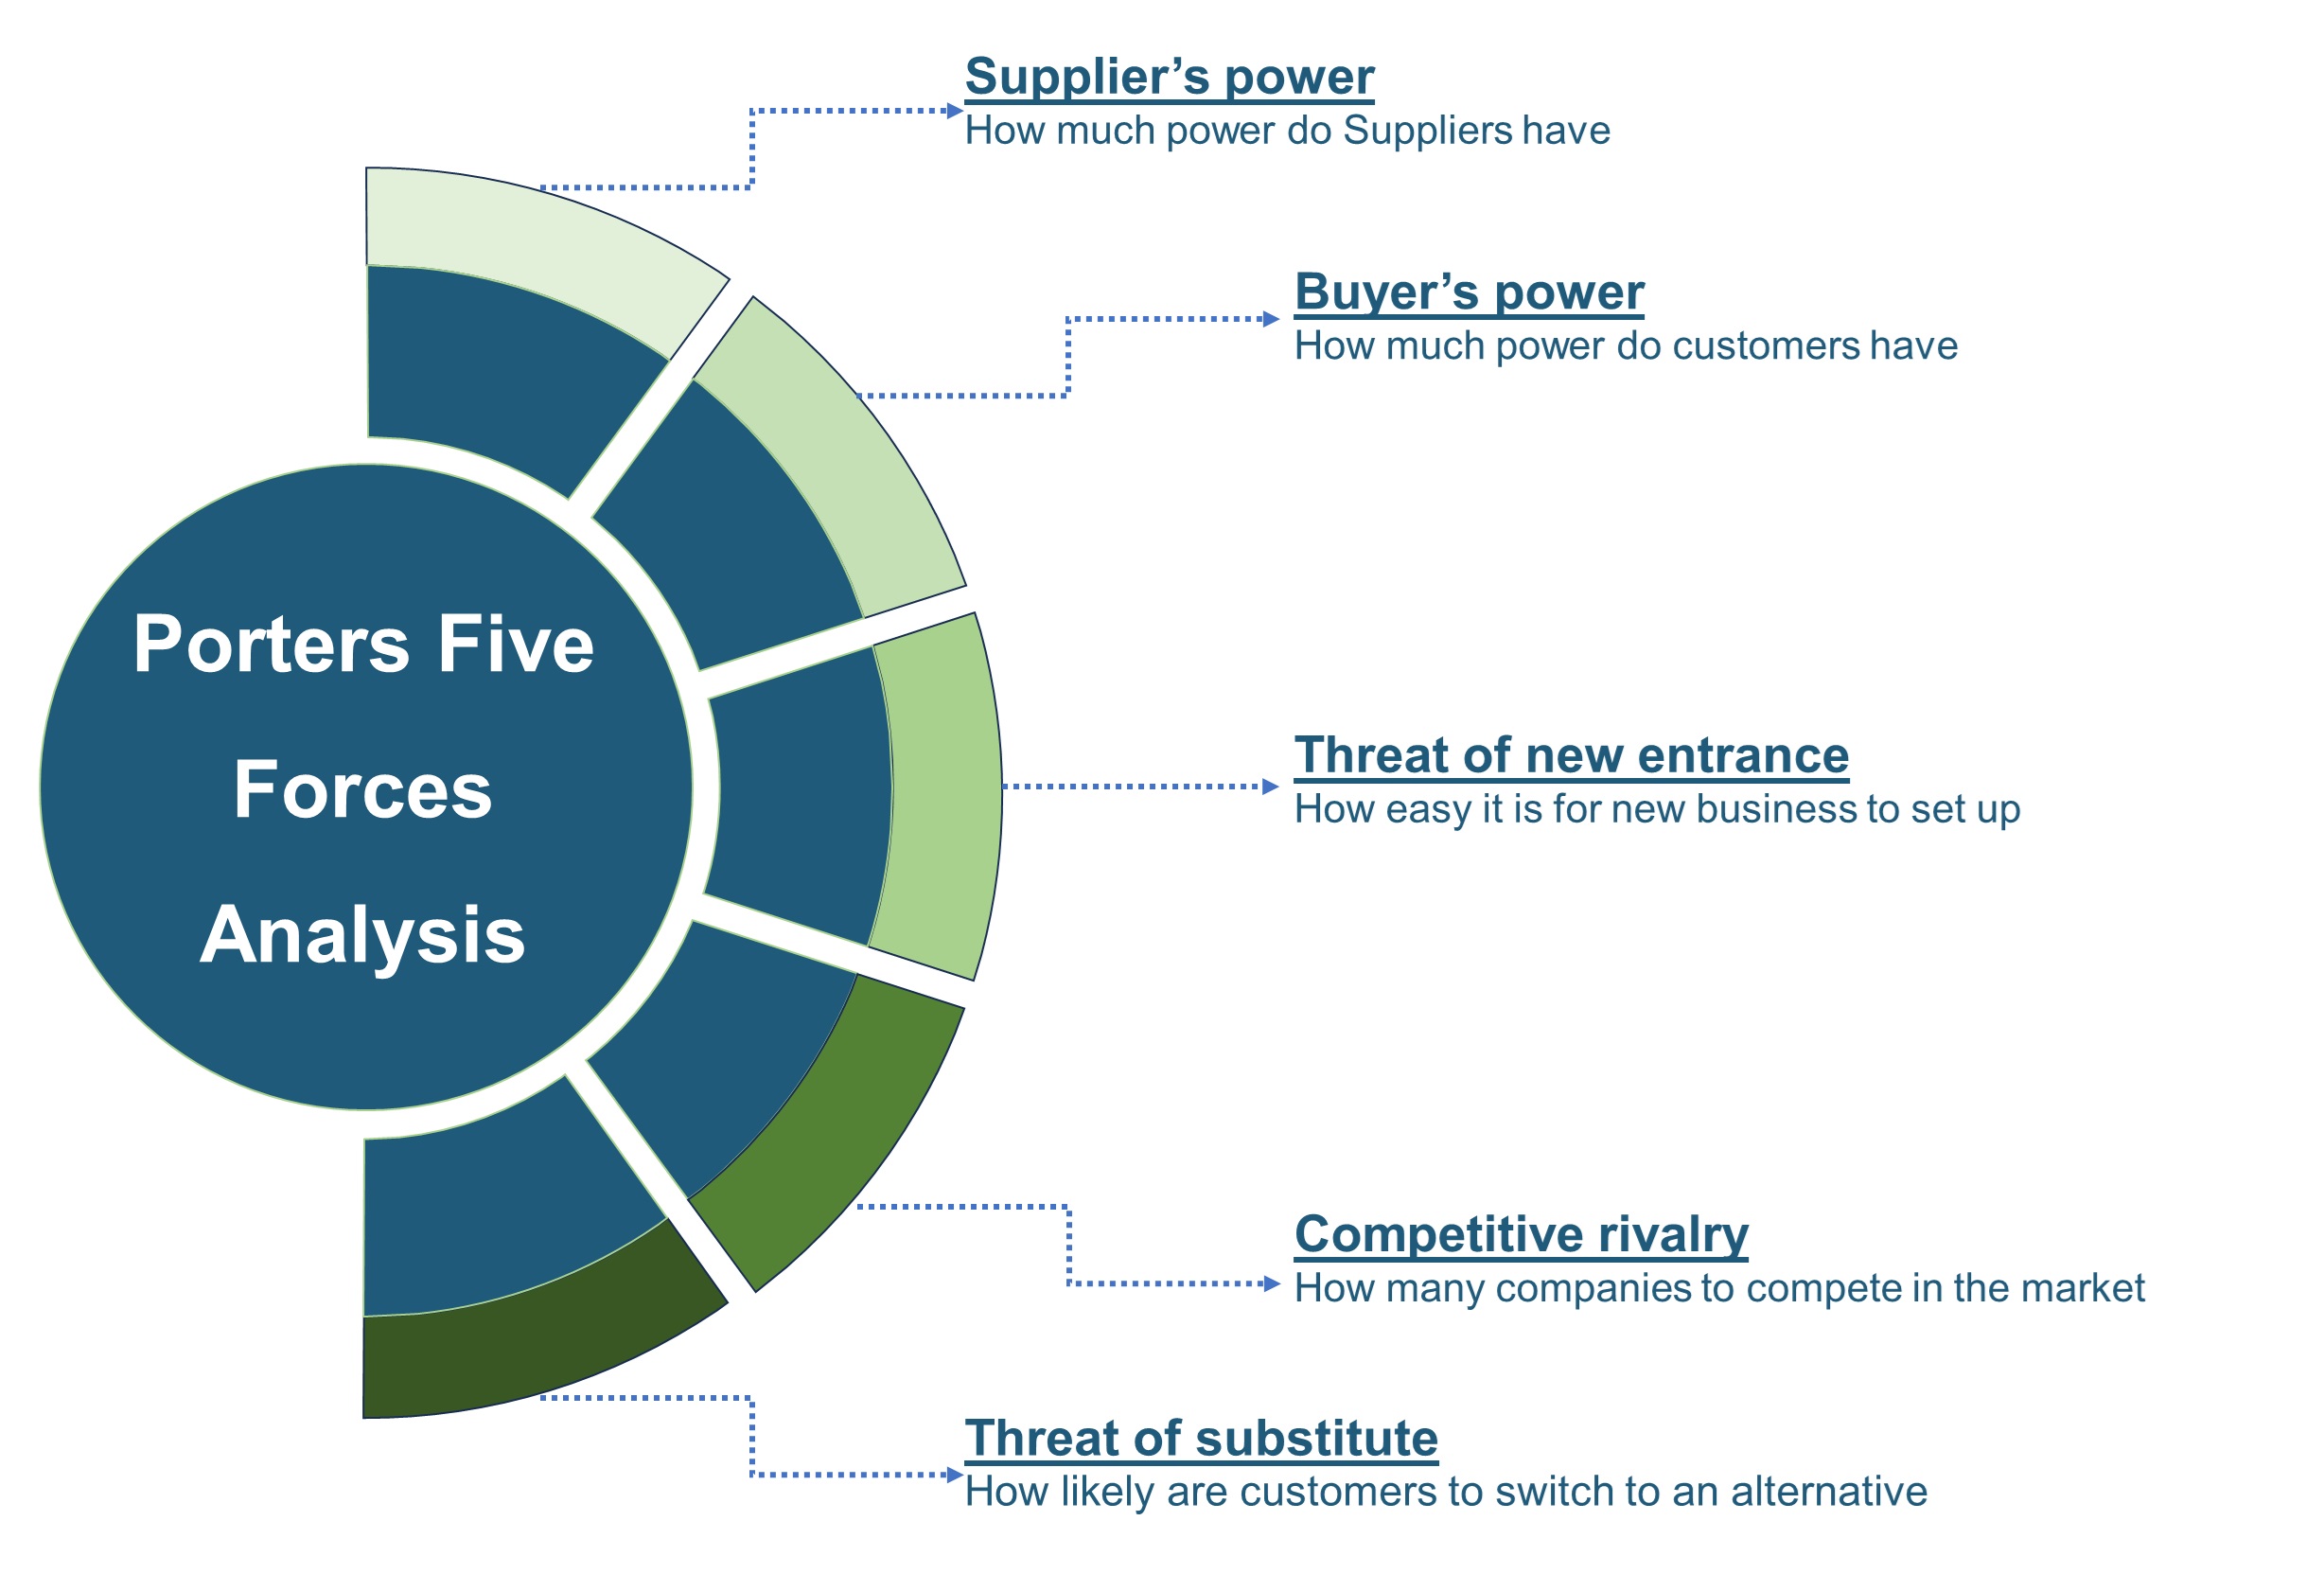
Porters Five Forces Analysis
We conduct Porter's Five Forces analysis to evaluate the competitive landscape of an industry, providing us with insights into factors that affect profitability and strategic positioning.
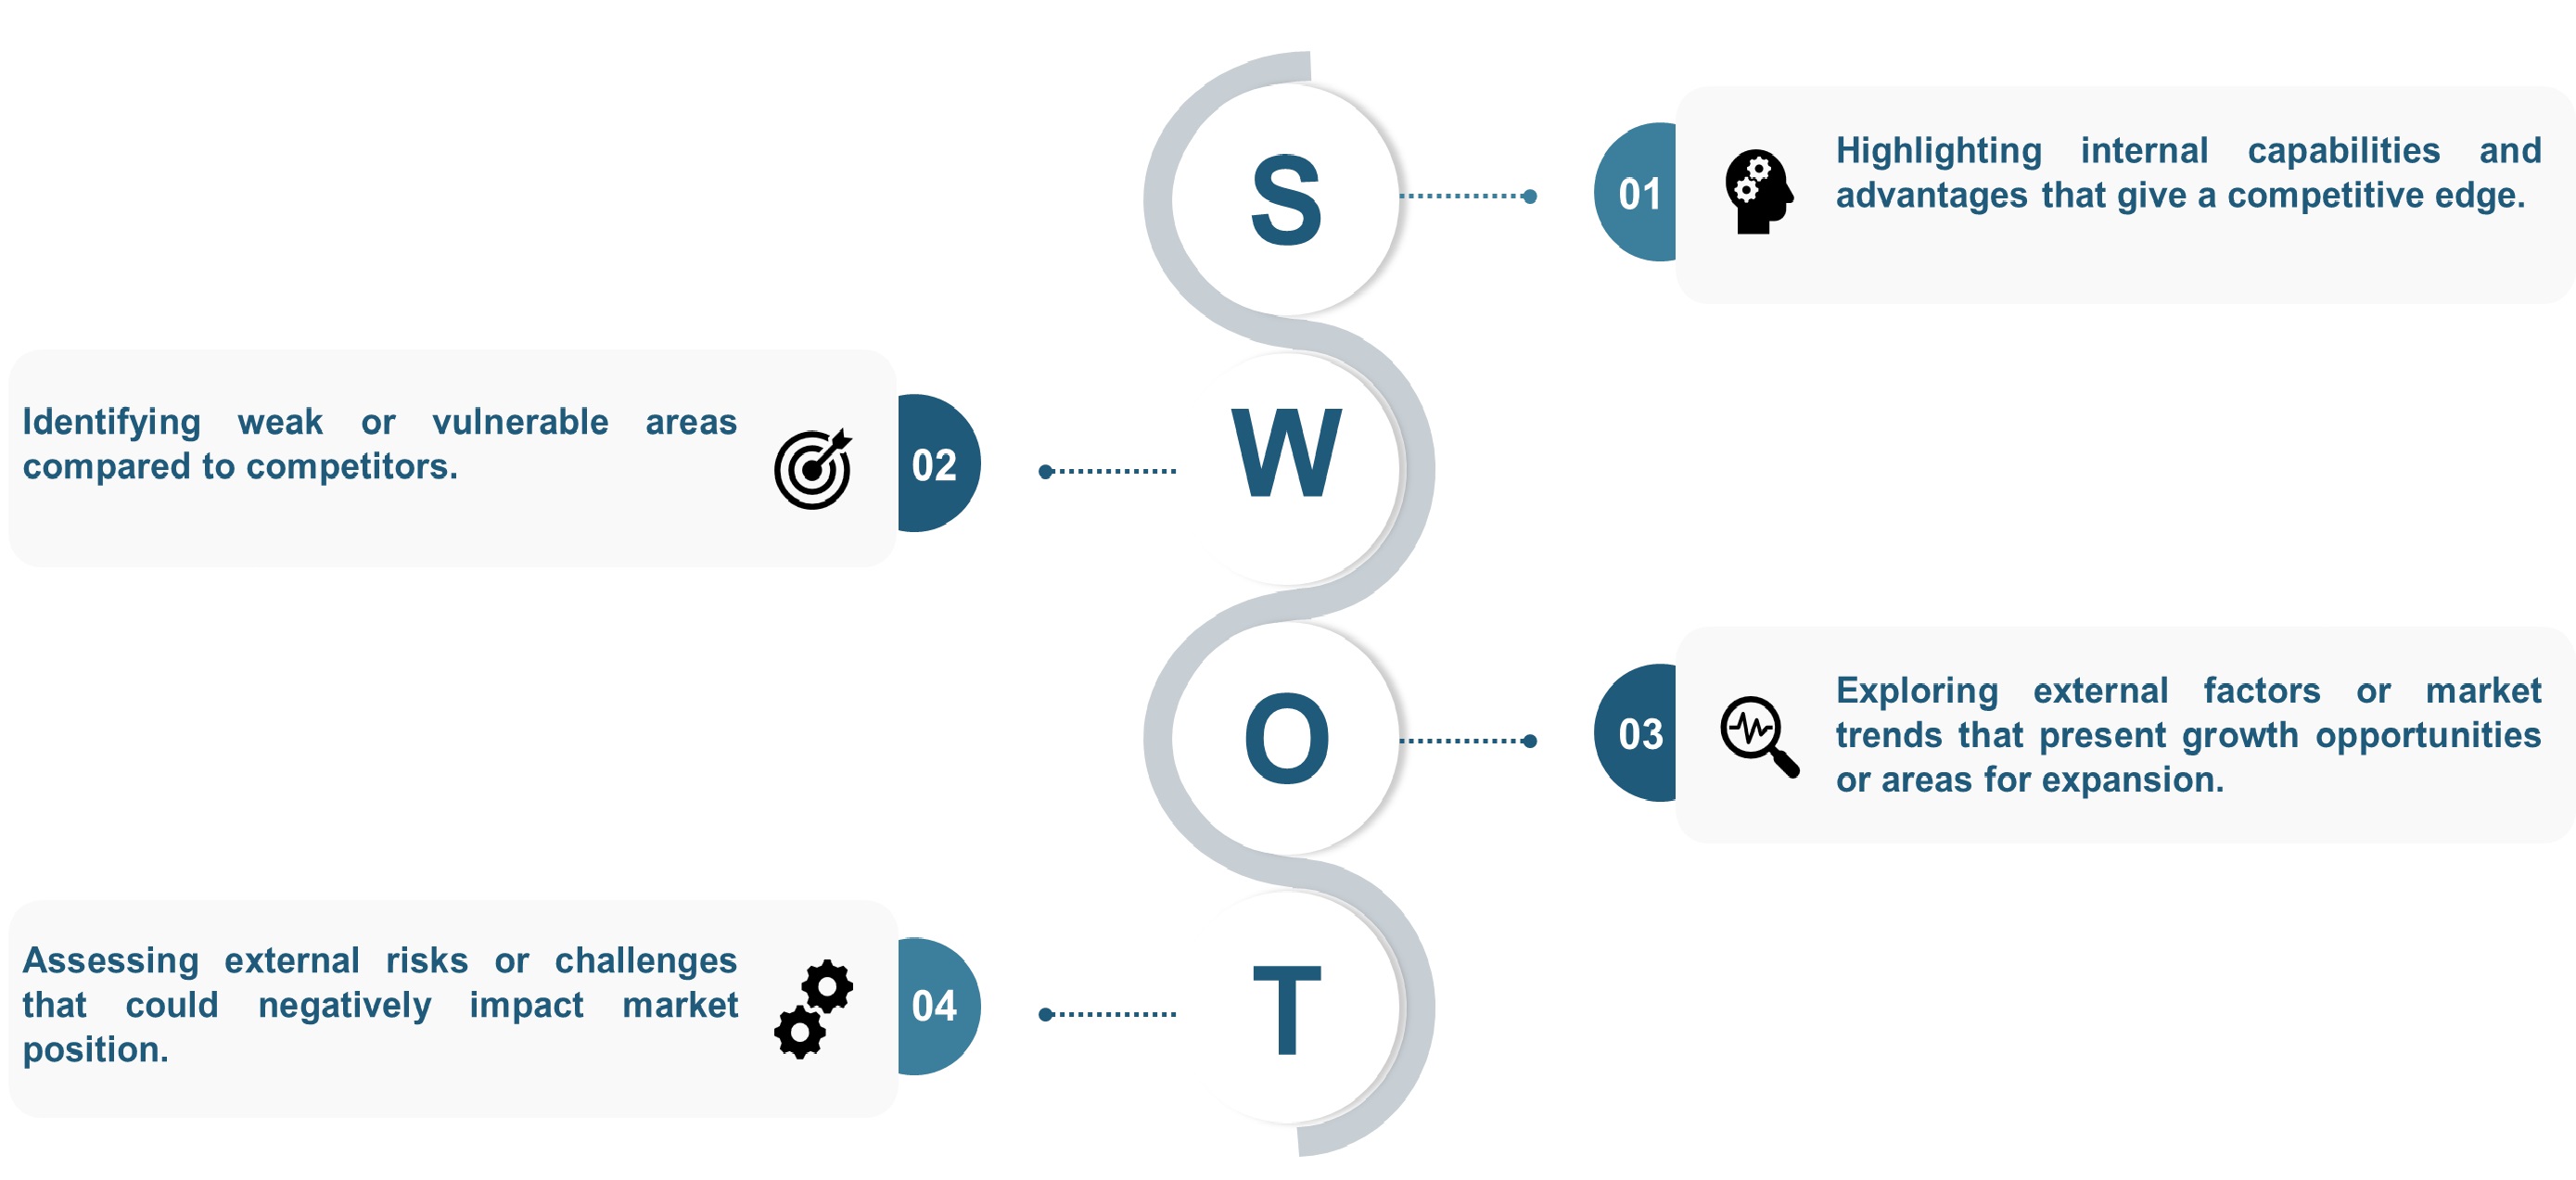
SWOT Analysis
We conduct SWOT analysis to understand market trends, identify potential threats, capitalize on opportunities, and assess our strengths and weaknesses.
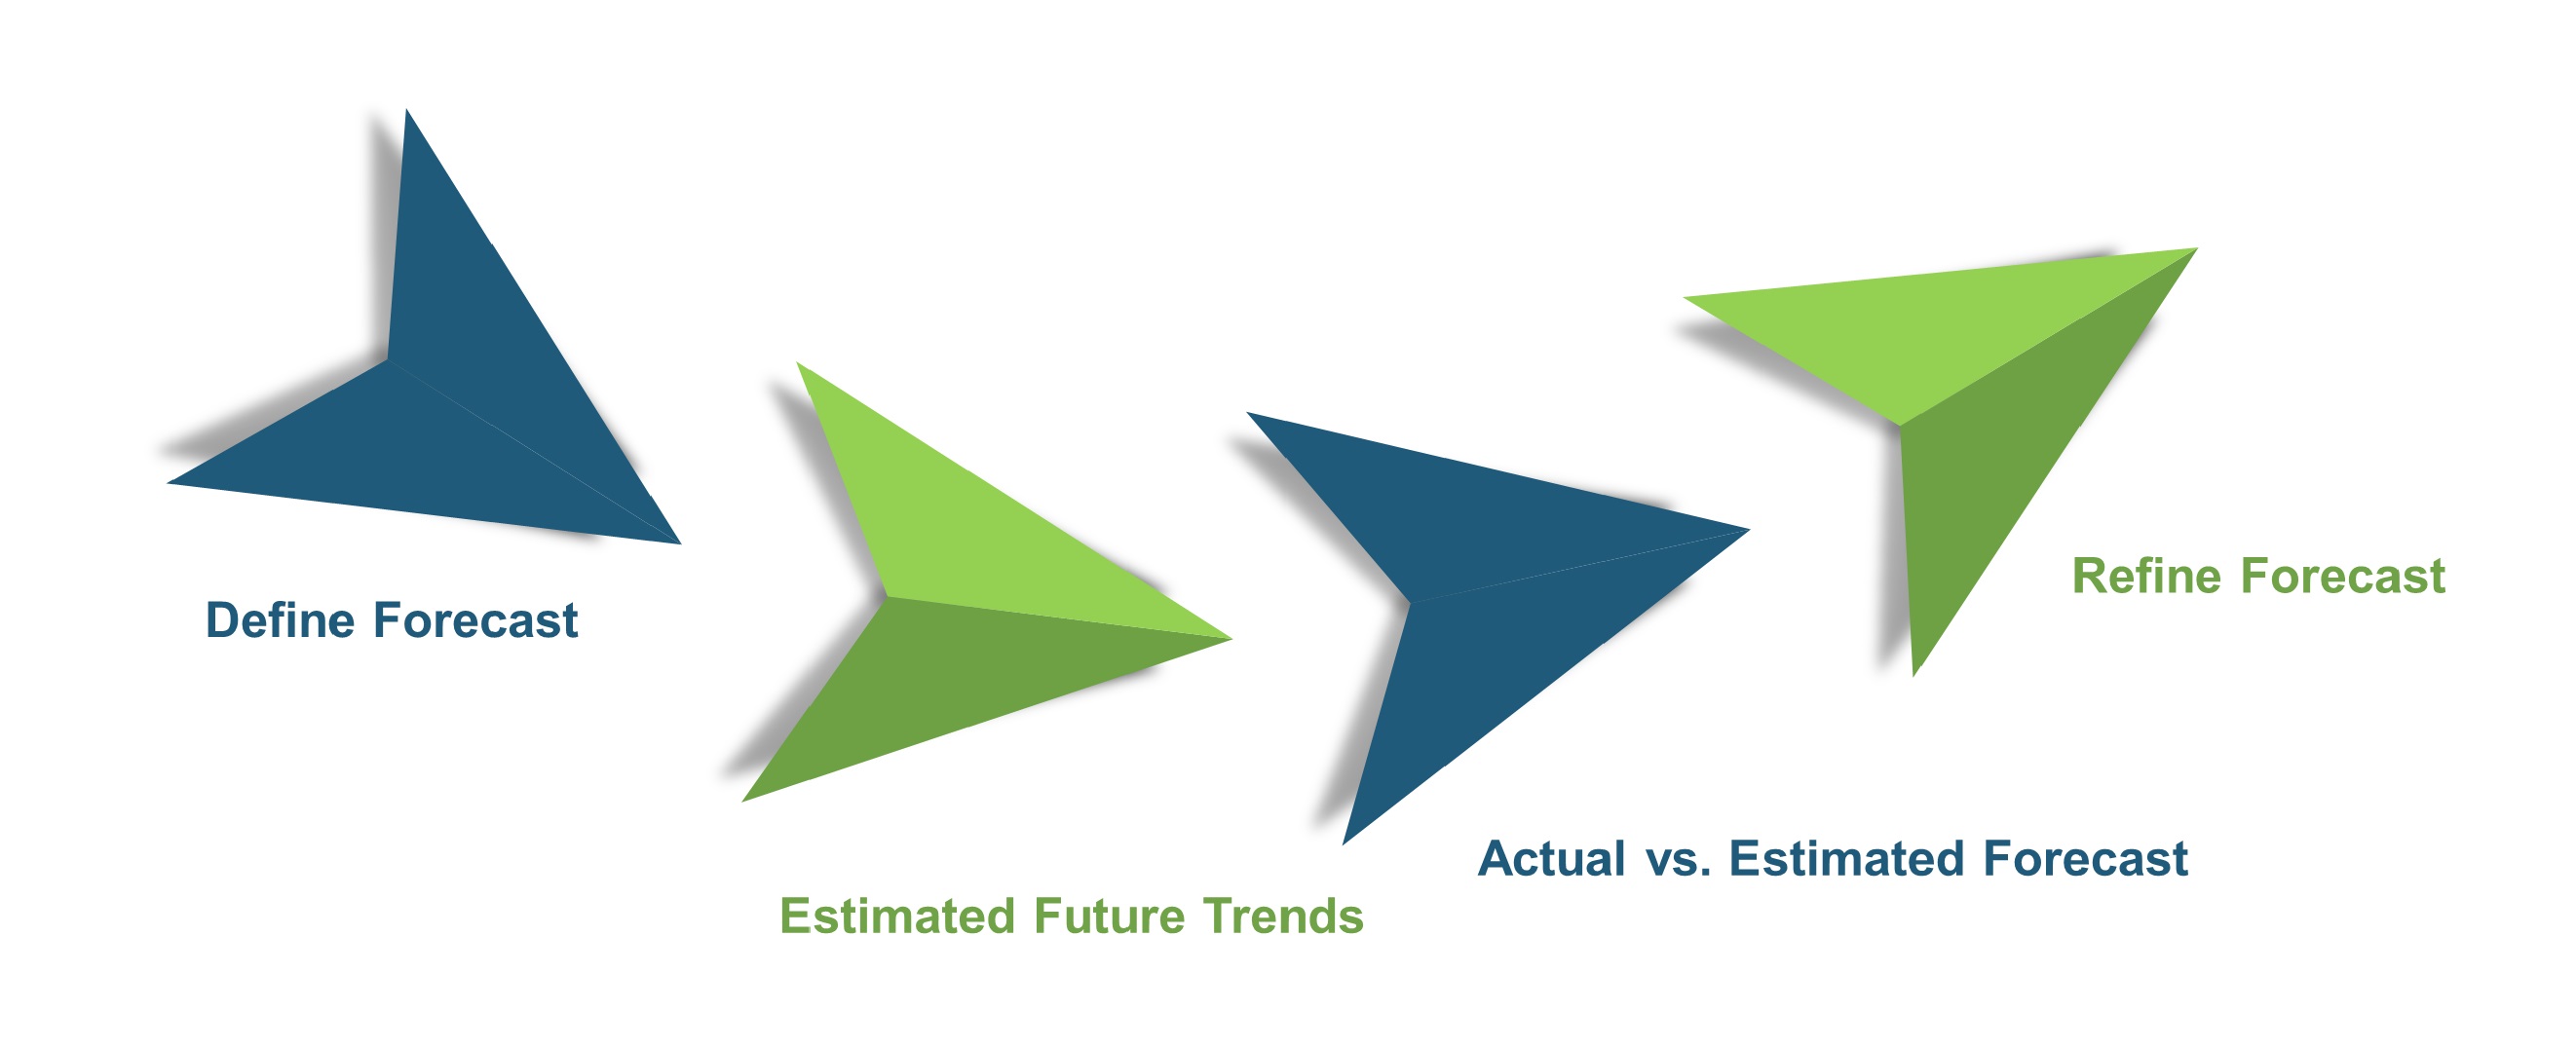
Forecasting
We utilize a forecasting model to predict future consumption by considering parameters like population, economics, regulations, market competition, drivers, constraints, technology, and pricing. We also employ statistical techniques such as multilinear regression, exponential smoothing, moving average, ARIMA, and Monte Carlo simulations for accurate predictions. In econometric forecasting, we analyzed short-term and long-term event impacts, attributing values based on regulatory frameworks, economic factors, and market events.
Frequently Asked Questions
Download Free Sample
 Speak to Our Analyst


Related Report


Related Blogs
The Role of Emerging Tech in 5G Infrastructure
The 5G infrastructure industry is undergoing a paradigm shift, driven by a wave...


Top Fintech Firms Shaping the Mobile Payment Market
The global mobile payment market is expected to grow annually at a rate of 13.5%...

What’s Impacting the Growth of Digital Marketplaces Today?
Digital marketplaces act as intermediaries that facilitate transactions between...